Python绘图模板整理
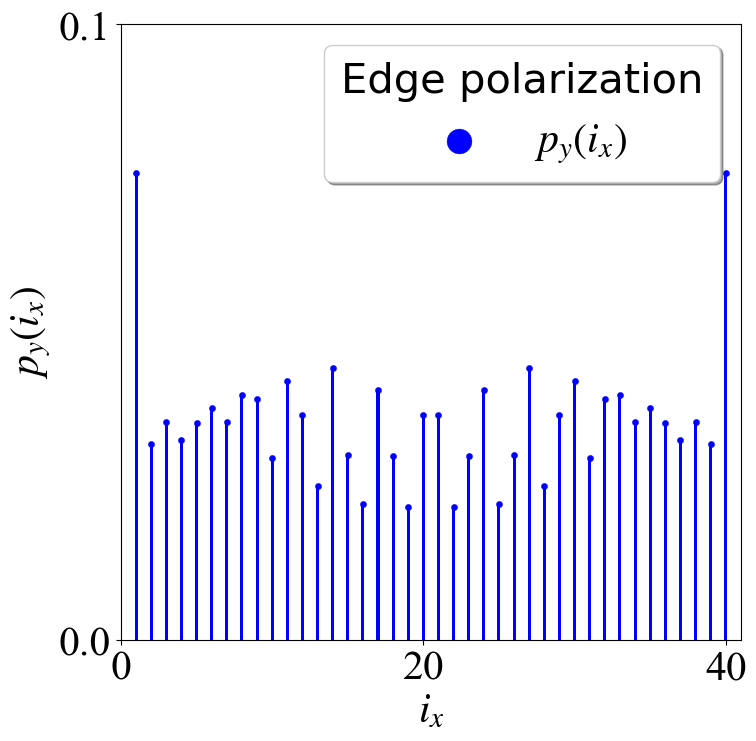
棒棒糖图
1 | from cProfile import label |
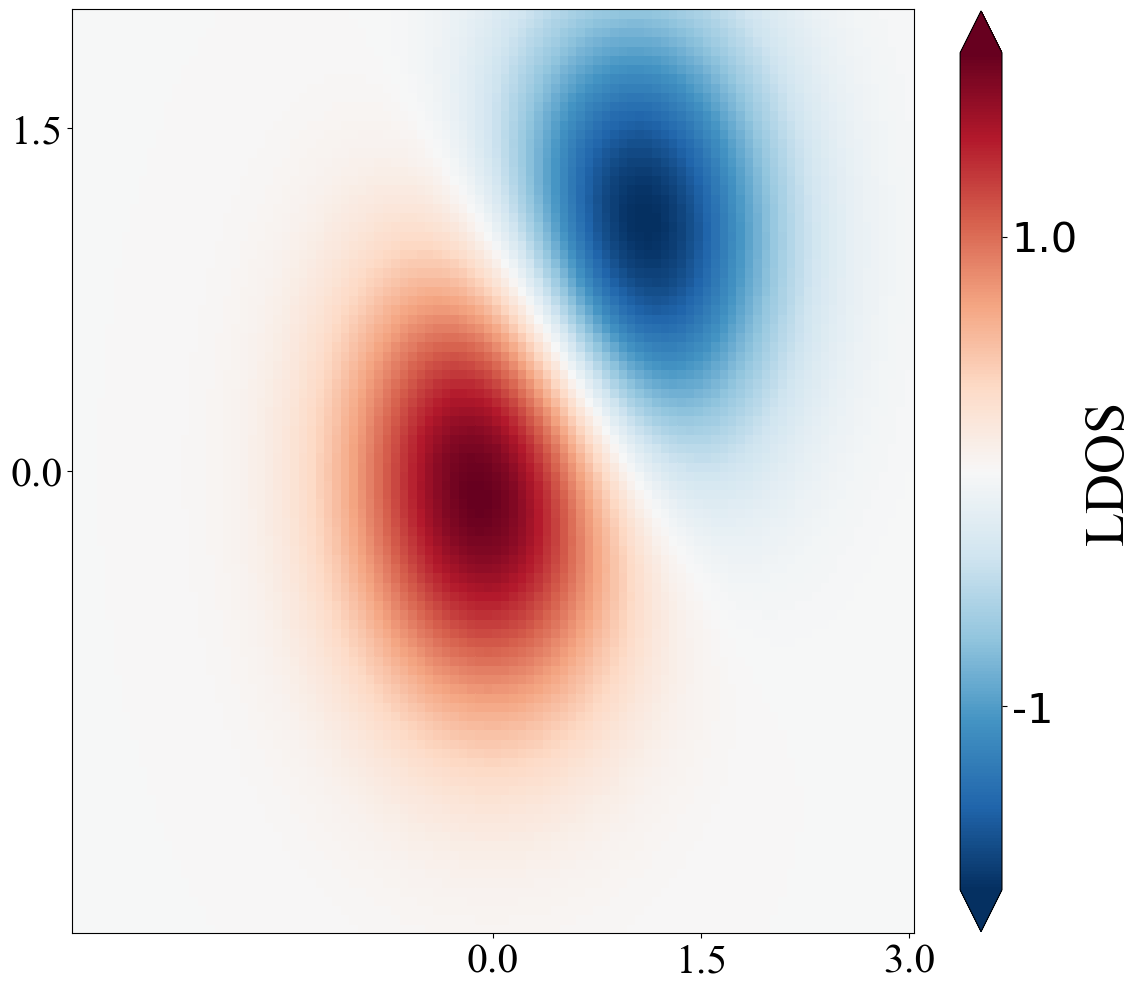
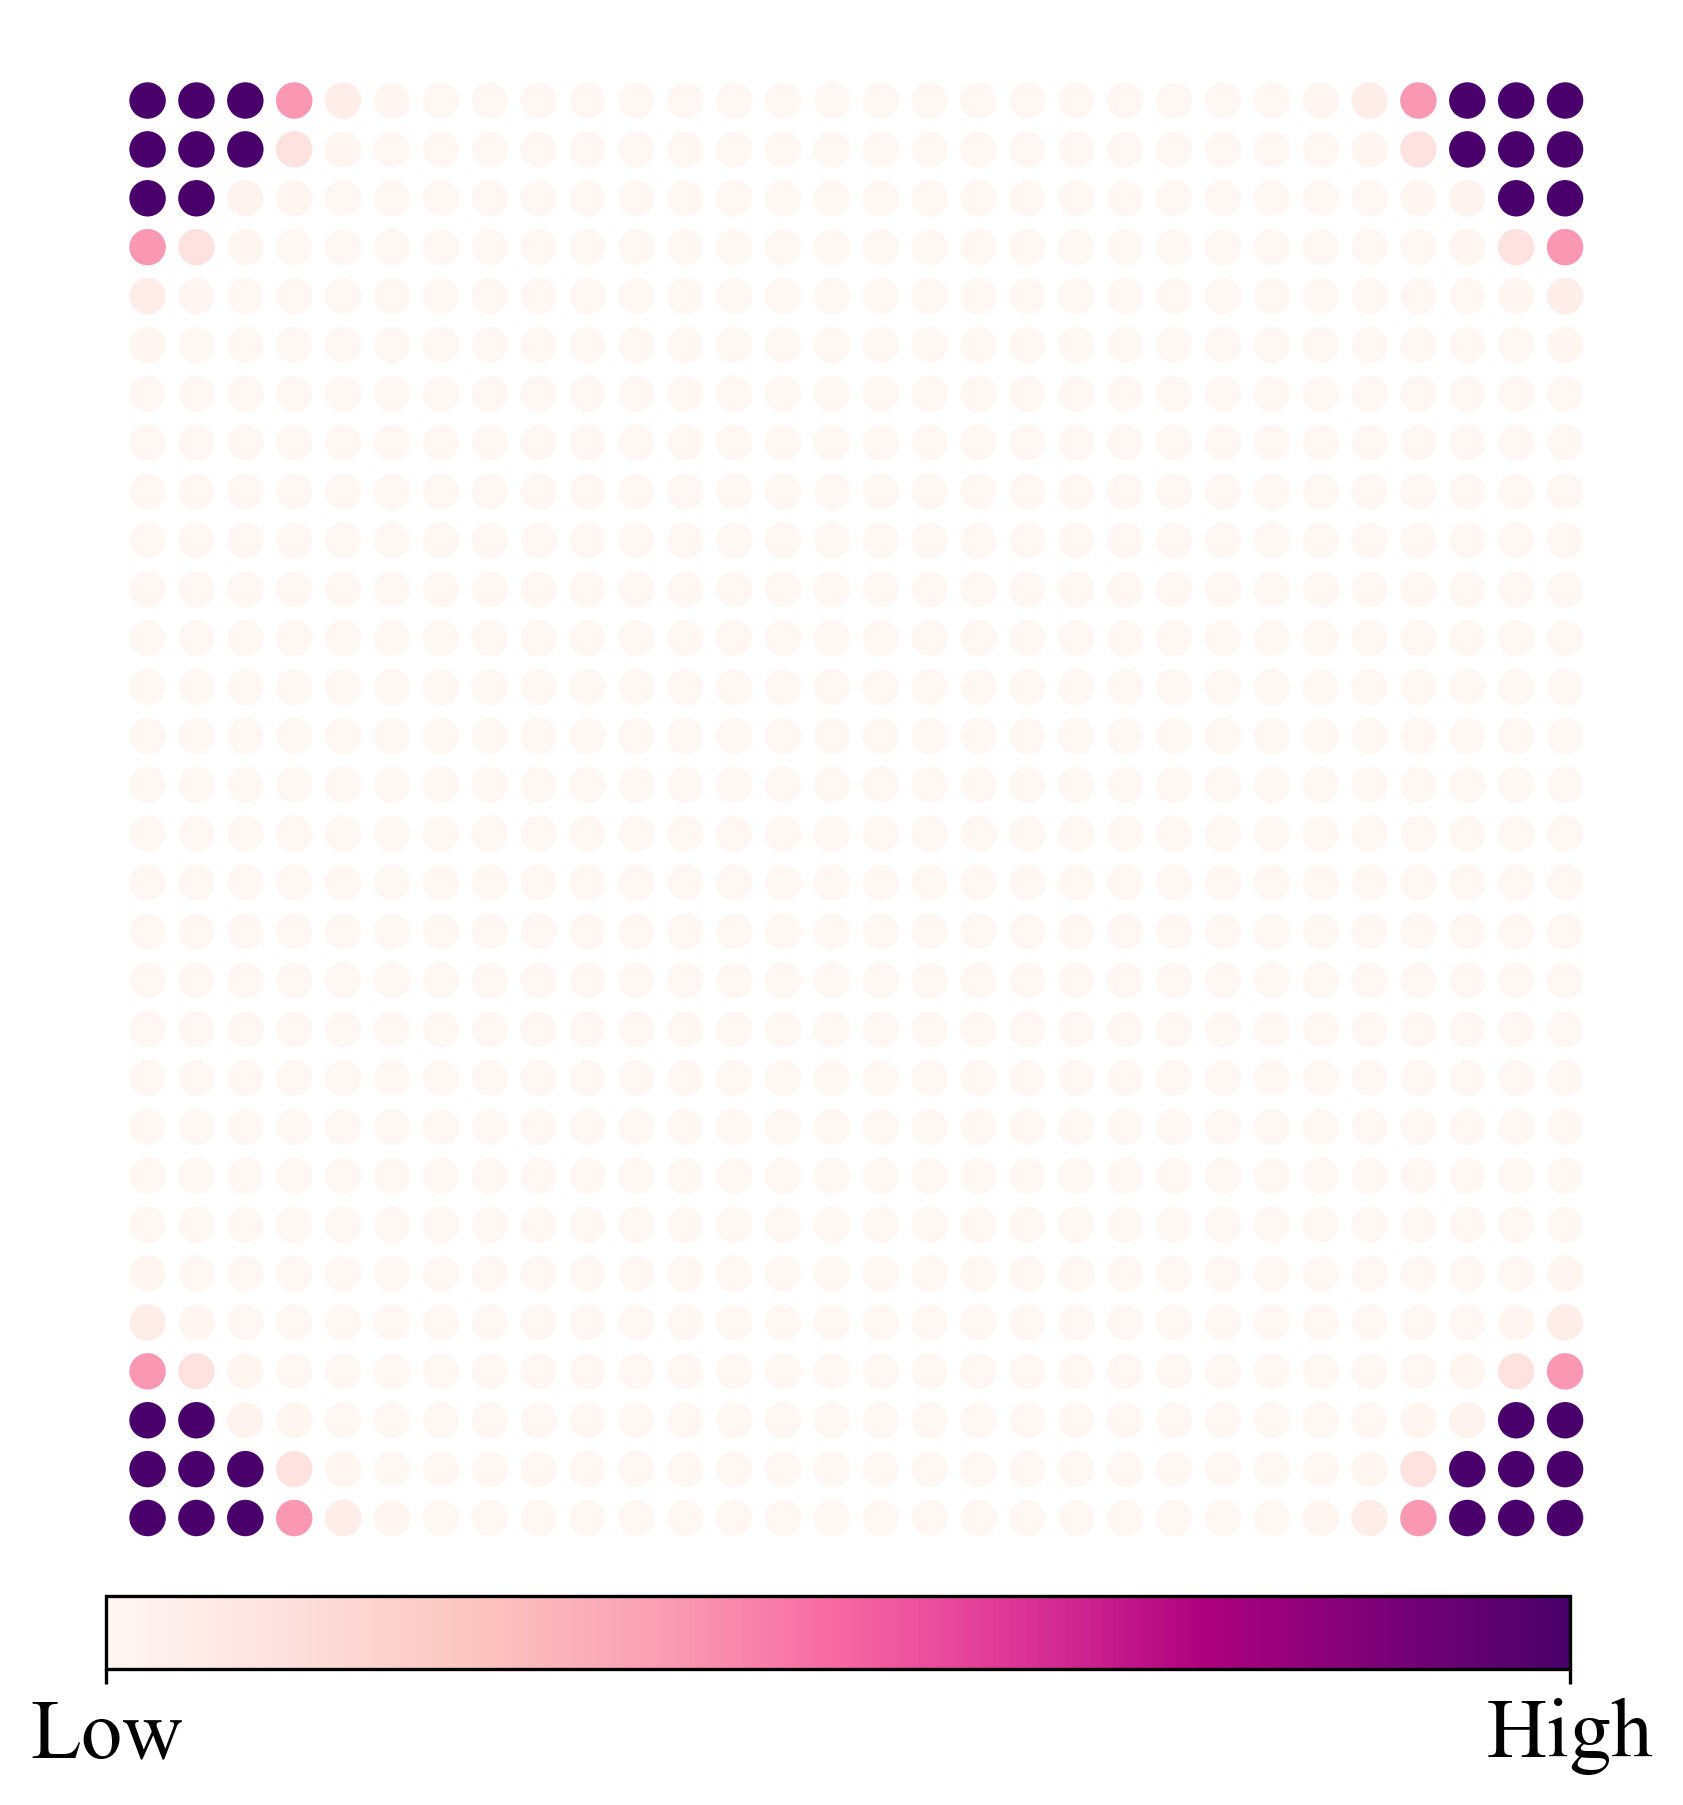
密度图(Python)
1 | def density(): |
y轴堆叠图
1 | import matplotlib.pyplot as plt |
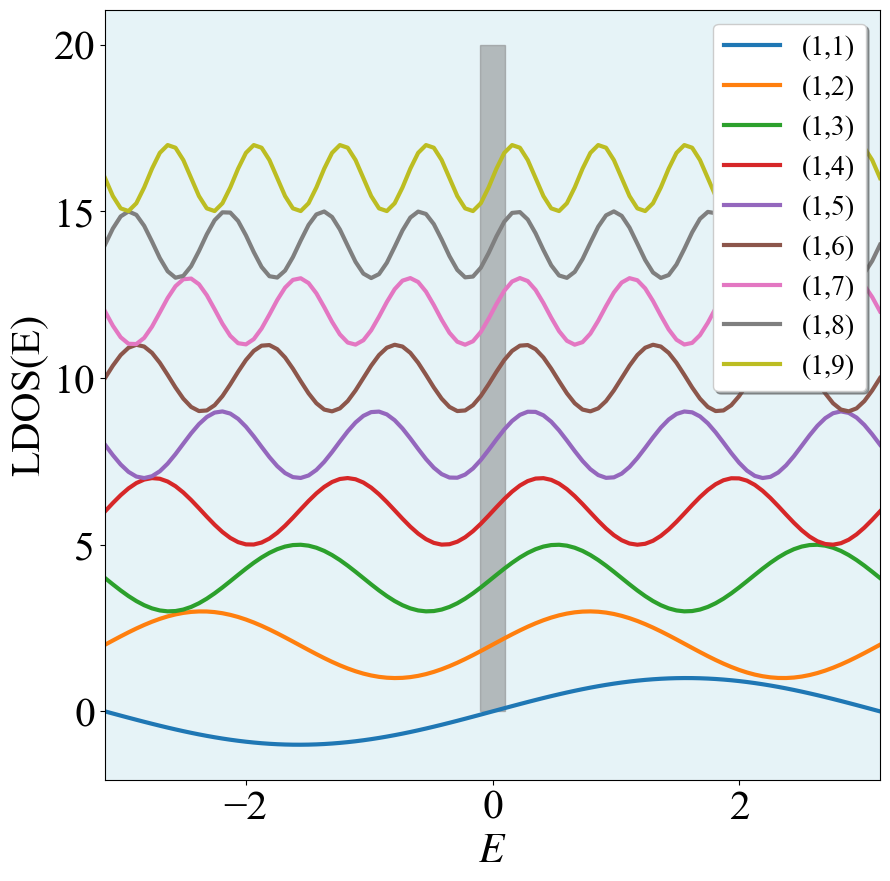
1 | for i0 in range(1,10): |
这里只需要把(i0 - 1)*2去掉就可以实现非堆叠的效果。
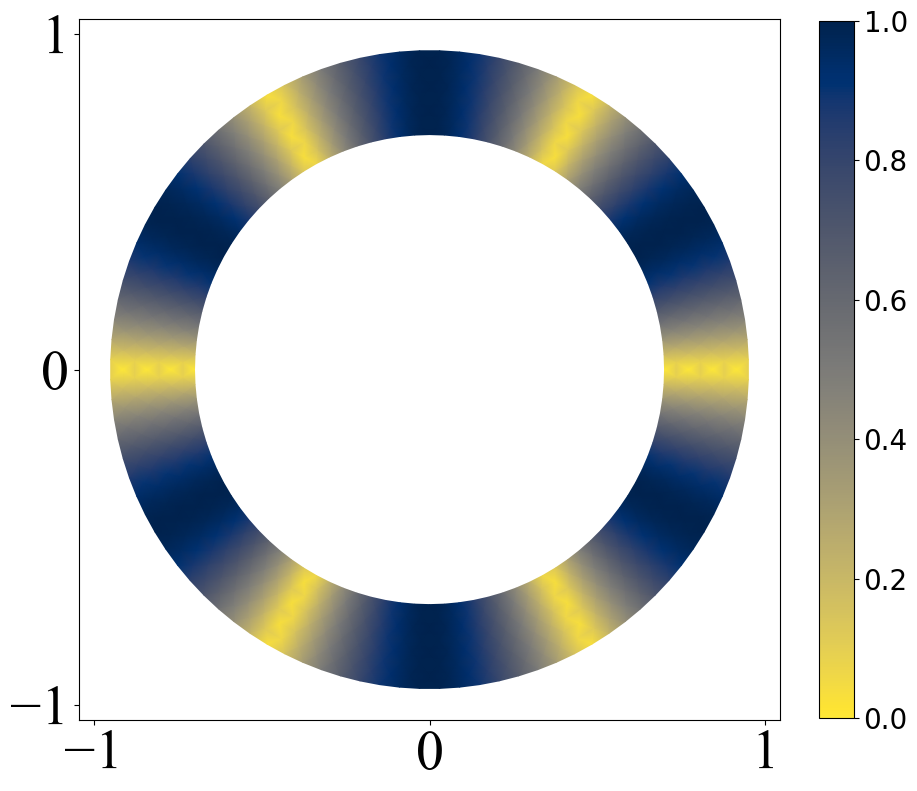
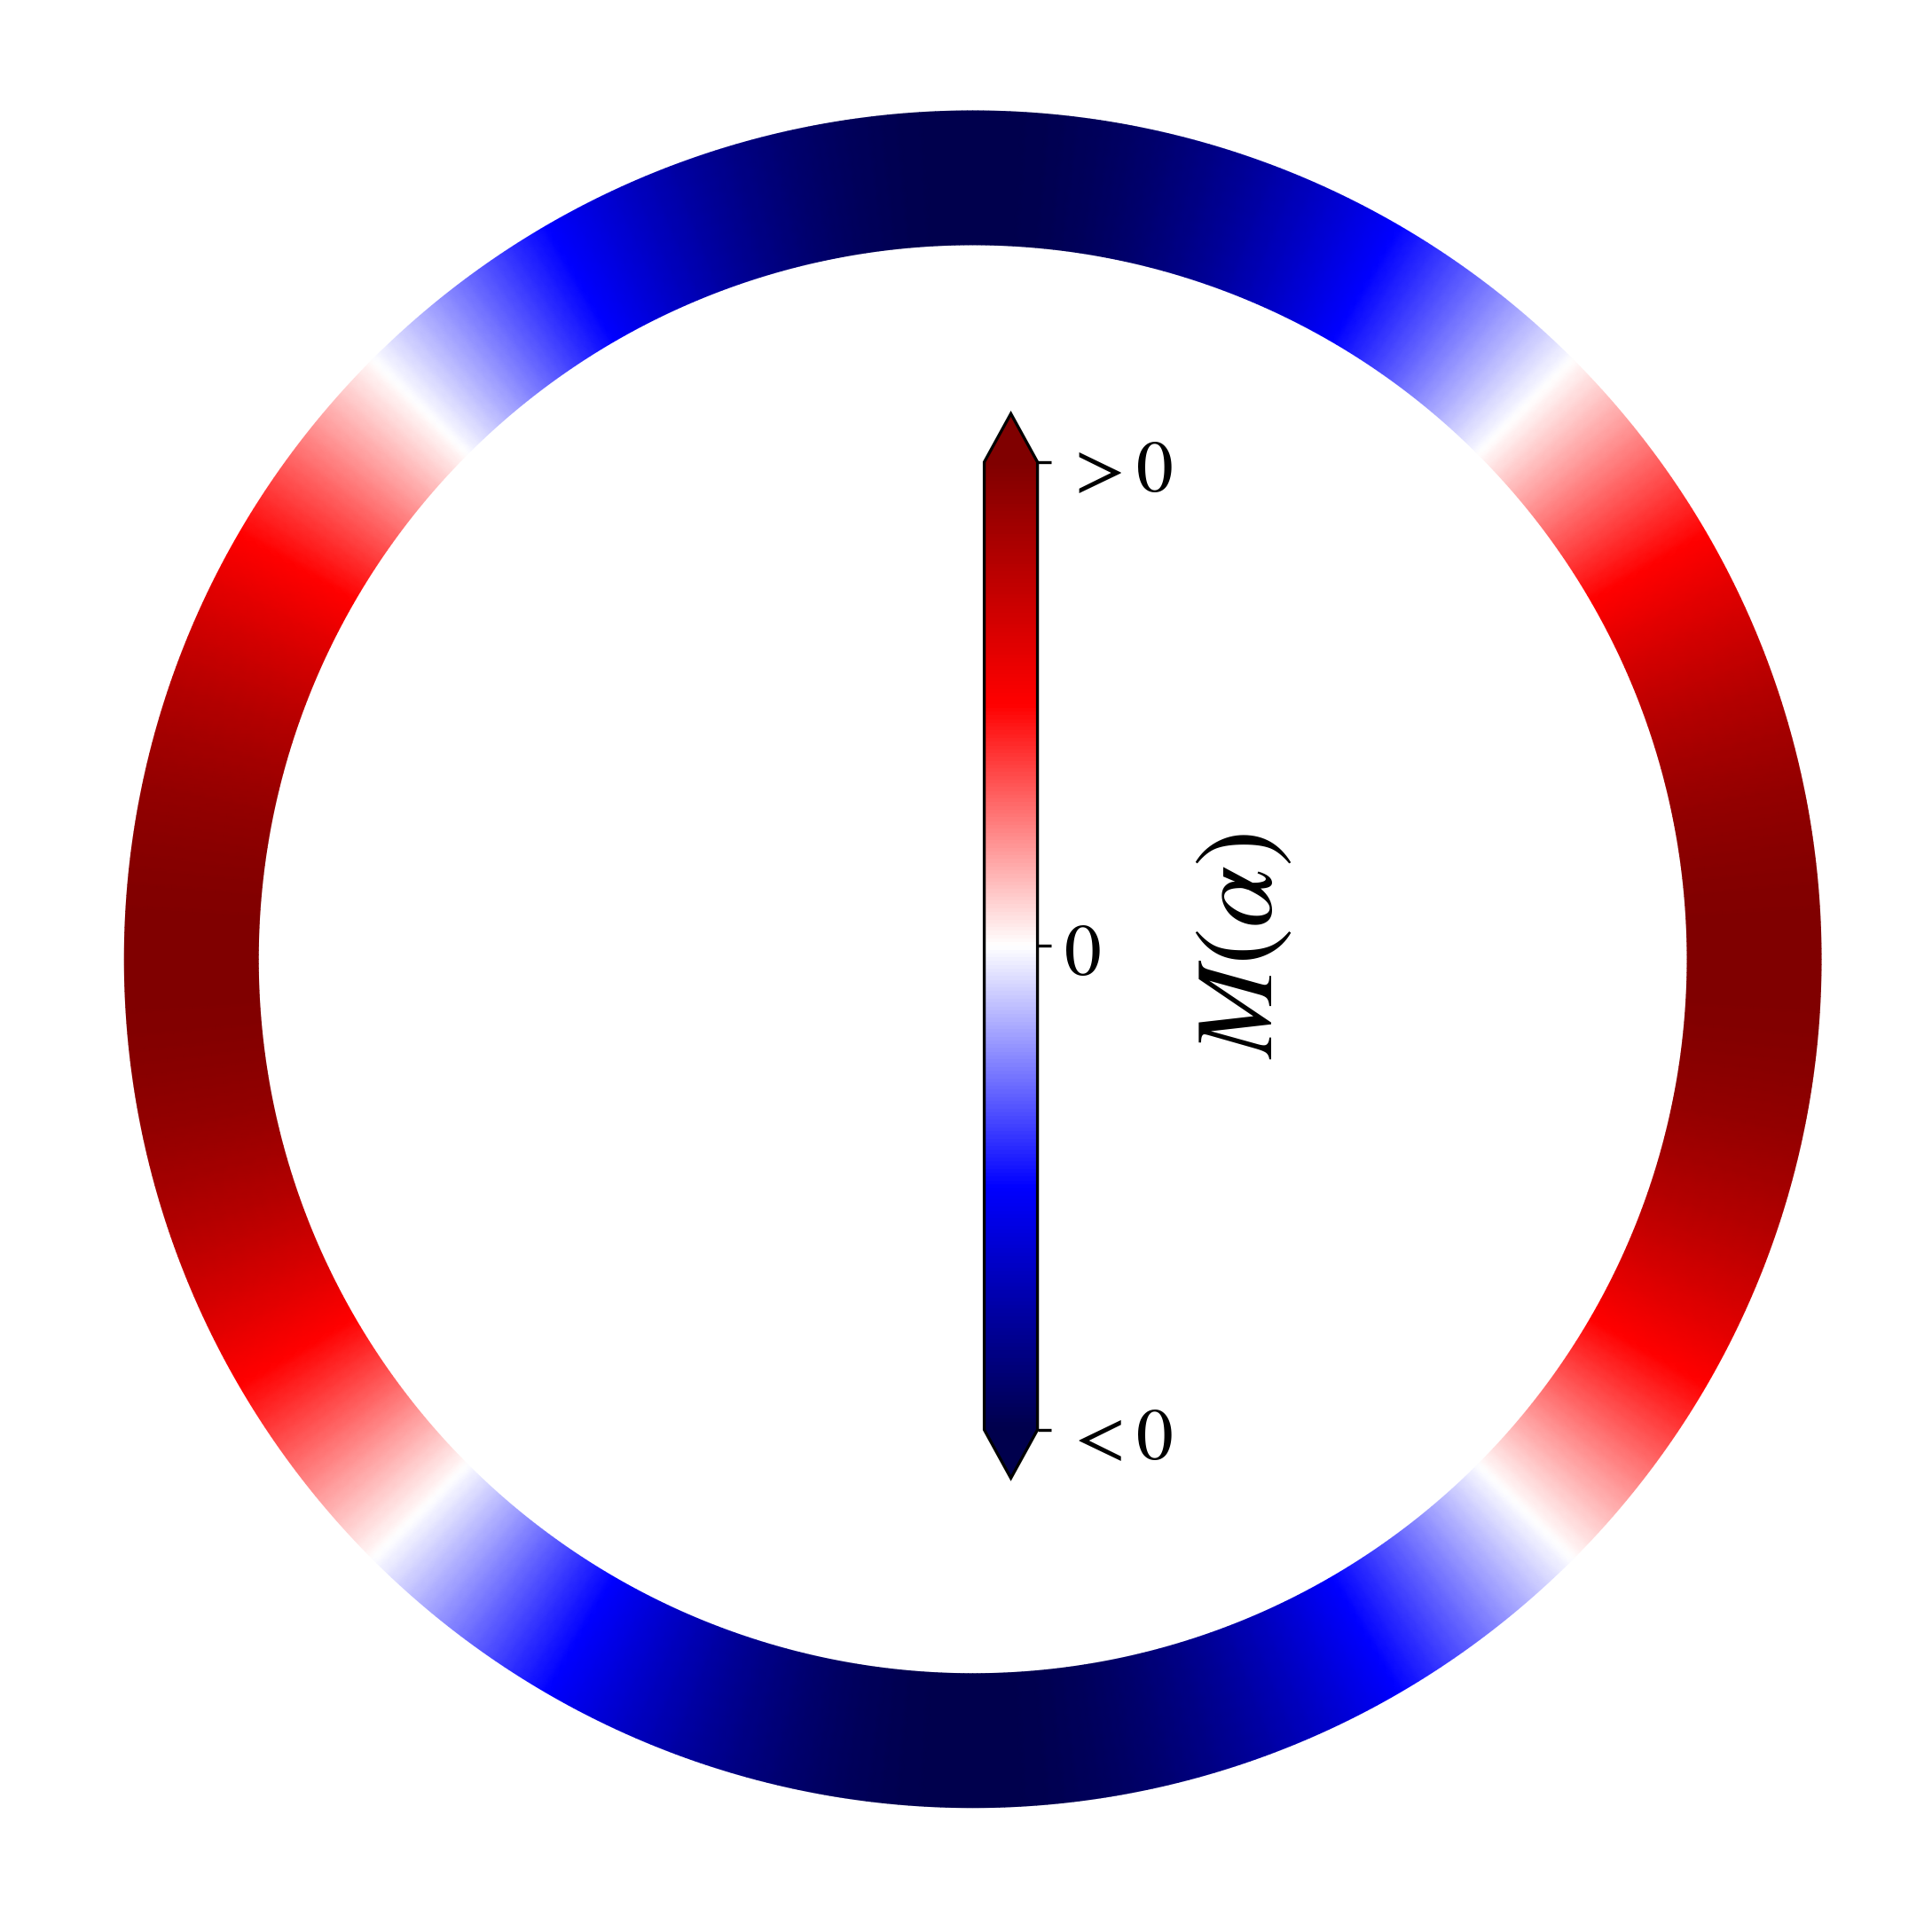
变色圆环
有时候想画一个随着角度变化的密度图,这里就给出一个例子,主要就是将matplotlib官网中的例子进行了修改1
2
3
4
5
6
7
8
9
10
11
12
13
14
15
16
17
18
19
20
21
22
23
24
25
26
27
28
29
30
31
32
33
34
35
36
37
38
39
40
41
42
43
44
45import matplotlib.tri as tri
import numpy as np
import matplotlib.pyplot as plt
from matplotlib import rcParams
import os
config = {
"font.size": 30,
"mathtext.fontset":'stix',
"font.serif": ['SimSun'],
}
rcParams.update(config) # Latex 字体设置
#---------------------------------------
def pltring():
n_angles = 100
n_radii = 8
min_radius = 0.7
radii = np.linspace(min_radius, 0.95, n_radii)
angles = np.linspace(0, 2 * np.pi, n_angles, endpoint=False)
angles = np.repeat(angles[..., np.newaxis], n_radii, axis=1)
angles[:, 1::2] += np.pi / n_angles
x = (radii * np.cos(angles)).flatten()
y = (radii * np.sin(angles)).flatten()
z = (np.abs(np.sin(3 * angles))).flatten()
# Create the Triangulation; no triangles so Delaunay triangulation created.
triang = tri.Triangulation(x, y)
# Mask off unwanted triangles.
triang.set_mask(np.hypot(x[triang.triangles].mean(axis=1),
y[triang.triangles].mean(axis=1))
< min_radius)
# plt.figure(figsize=(12,12))
fig2, ax2 = plt.subplots(figsize=(10,10))
ax2.set_aspect('equal')
tpc = ax2.tripcolor(triang, z, shading='gouraud',cmap = "cividis_r")
cb = fig2.colorbar(tpc,fraction = 0.045)
cb.ax.tick_params(labelsize=20)
plt.yticks([-1,0,1],fontproperties='Times New Roman', size = 40)
plt.xticks([-1,0,1],fontproperties='Times New Roman', size = 40)
# plt.show()
picname = "phase-3.png"
plt.savefig(picname, dpi=100, bbox_inches = 'tight')
plt.close()
1 | def pltring(cont): |
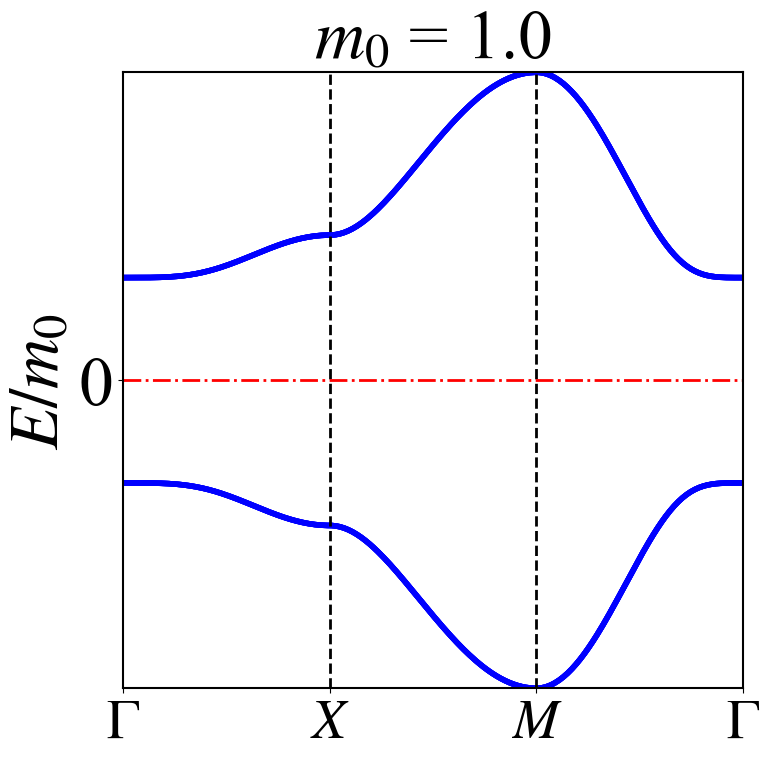
高对称路径能带图
1 | import numpy as np |
密度图2
1 | def ldosplt(cont): |
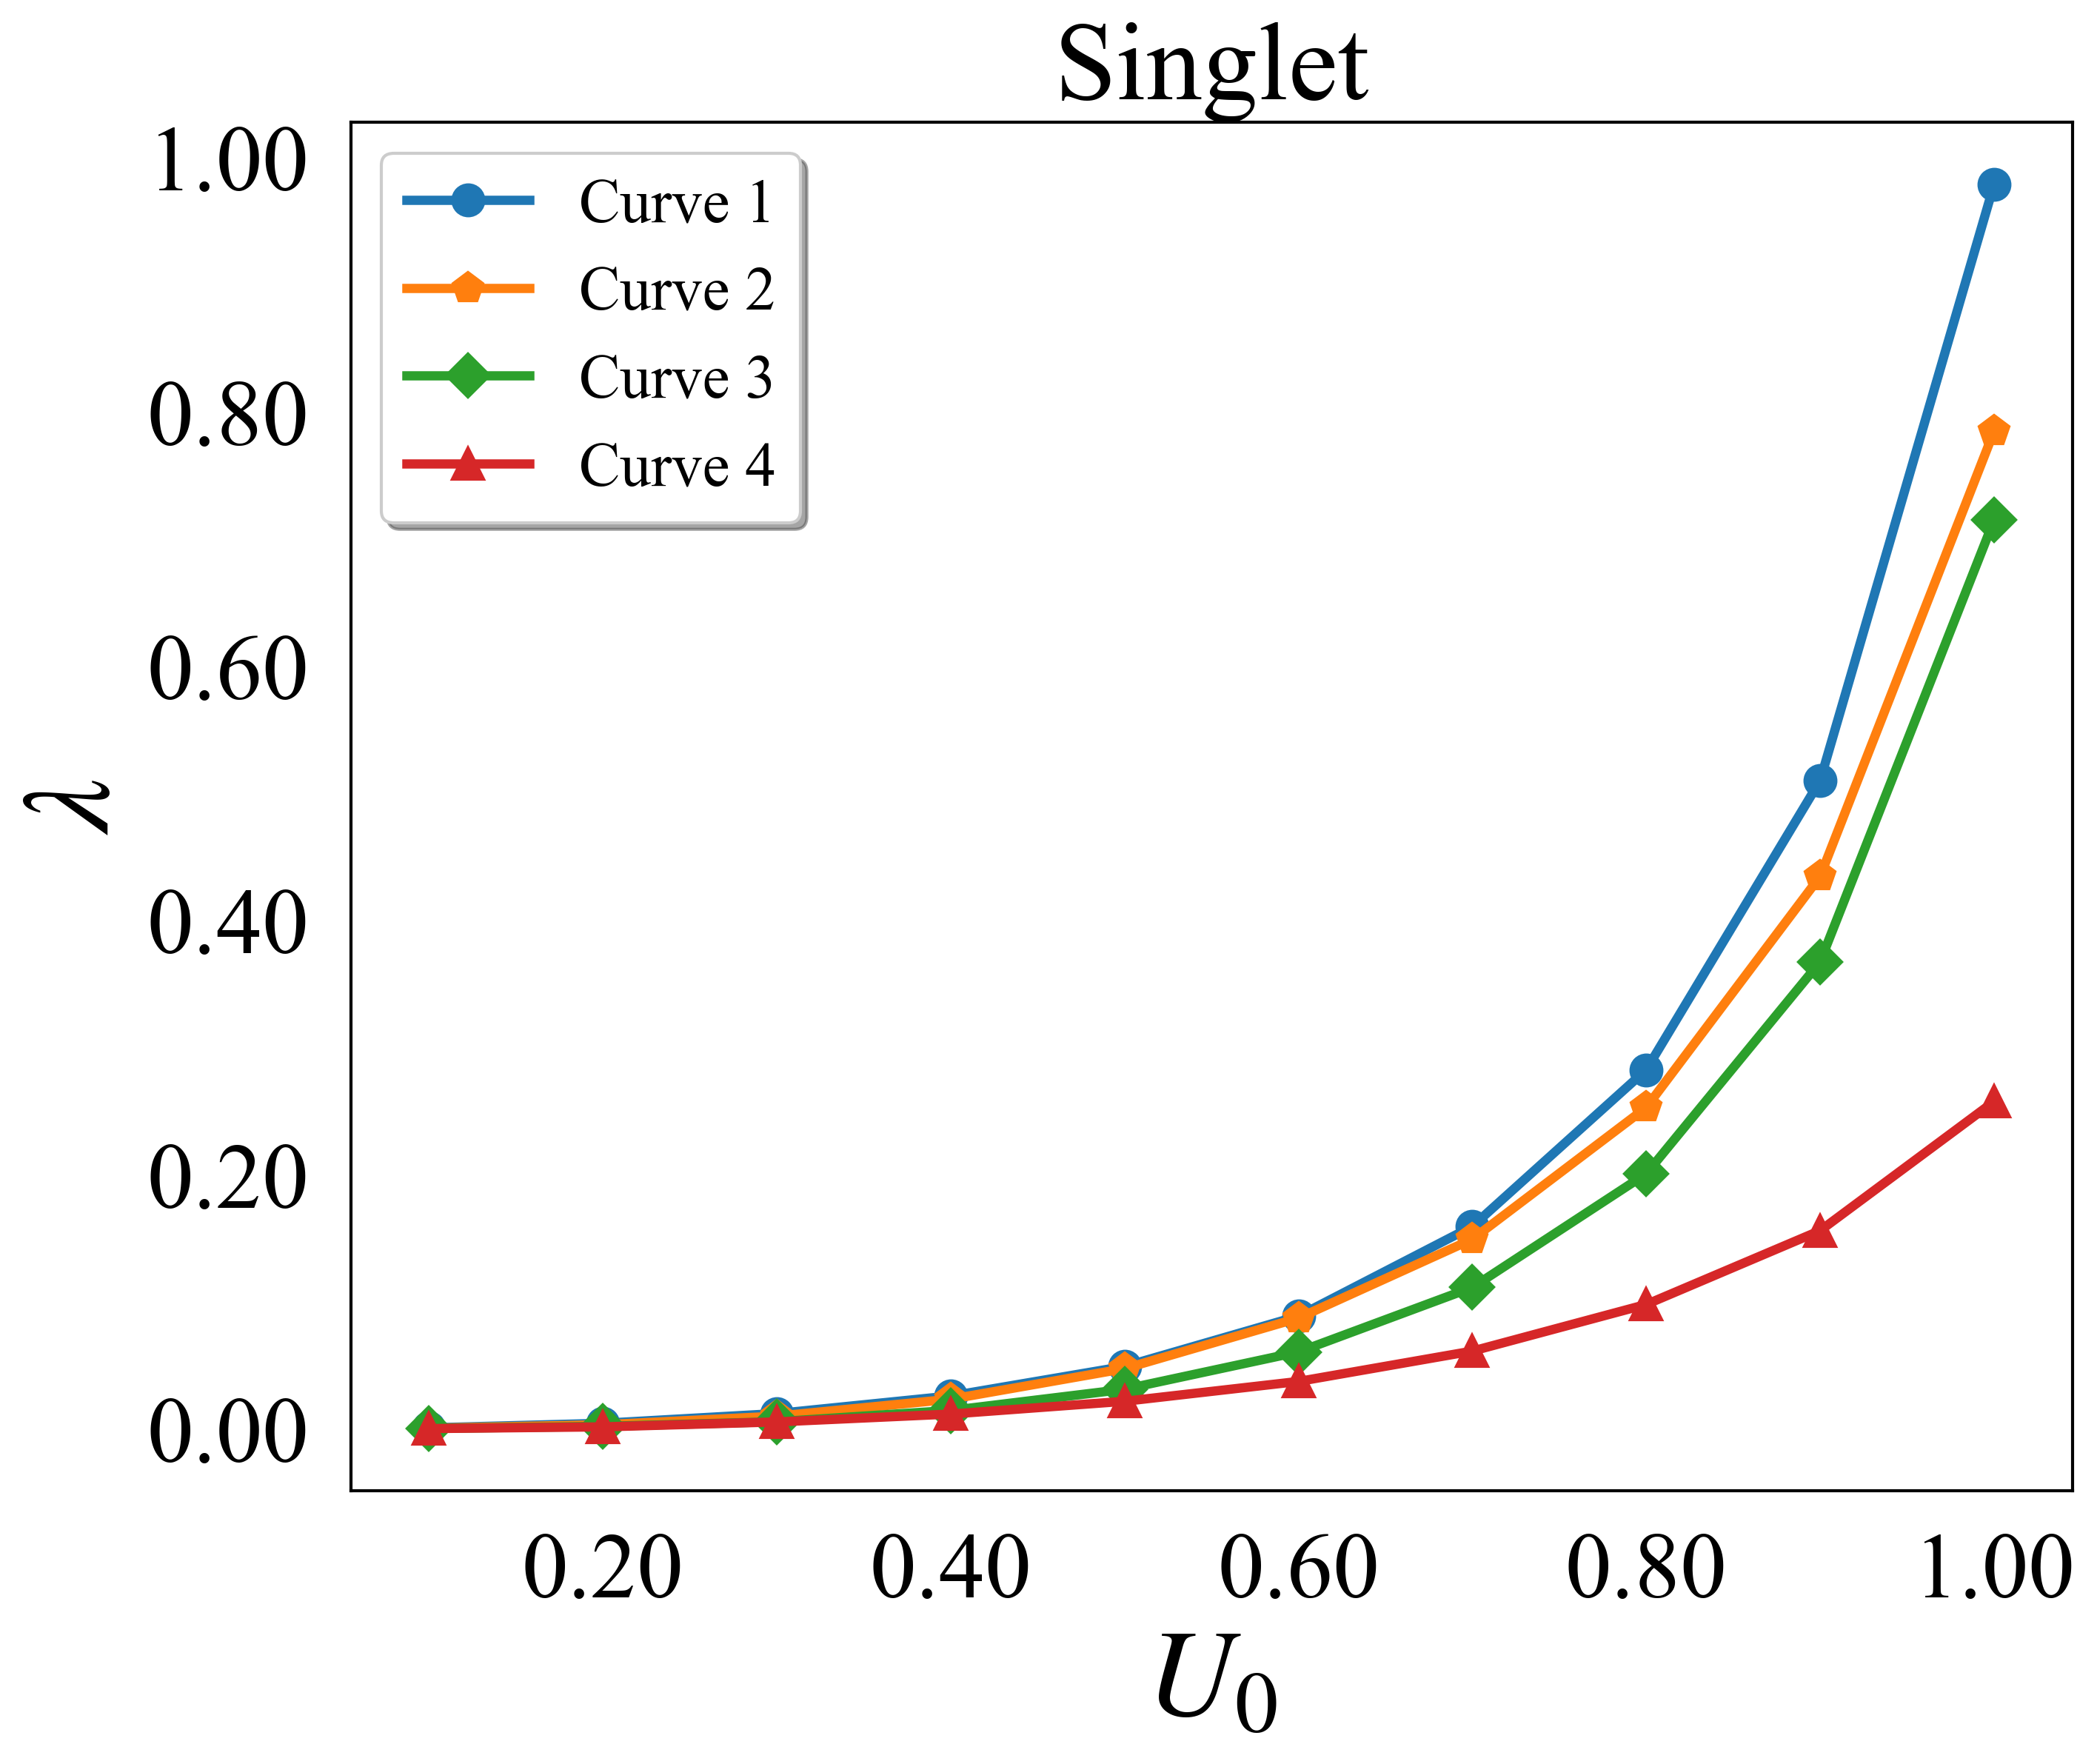
线图+scatter
1 | import numpy as np |
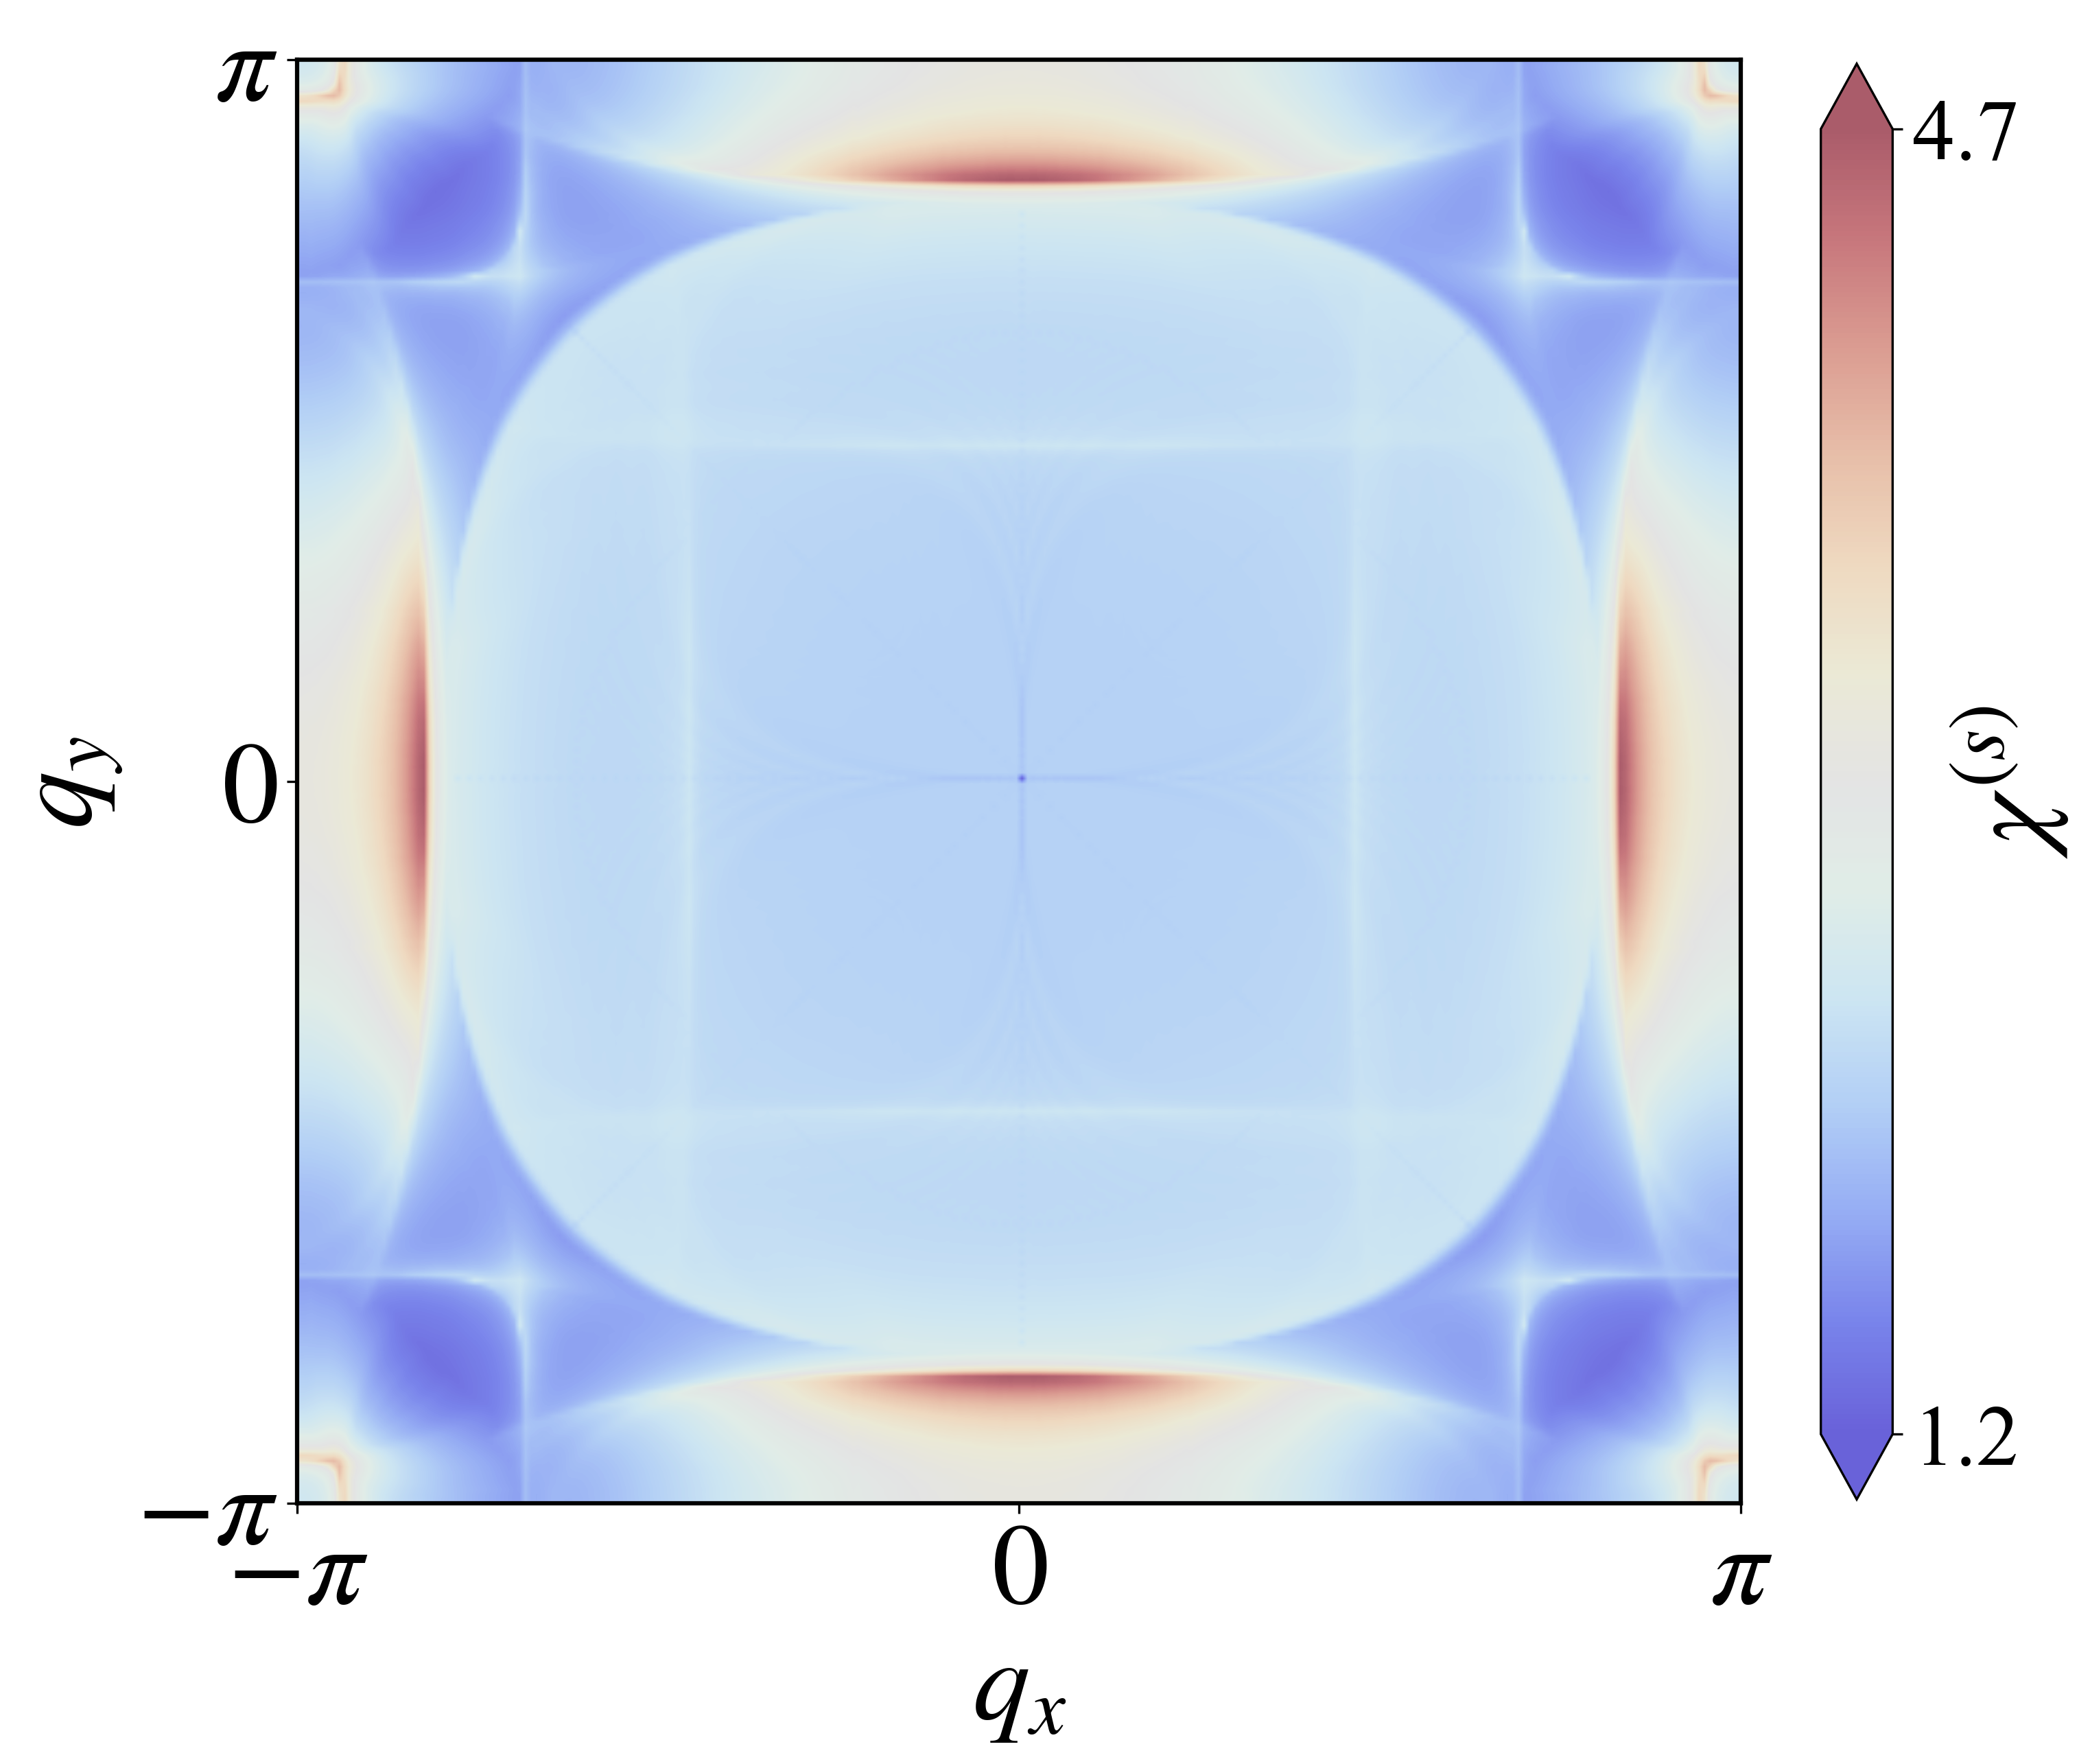
自定义colorbar
1 | def plotchi2(numk): |
子图排列
1 | import numpy as np |
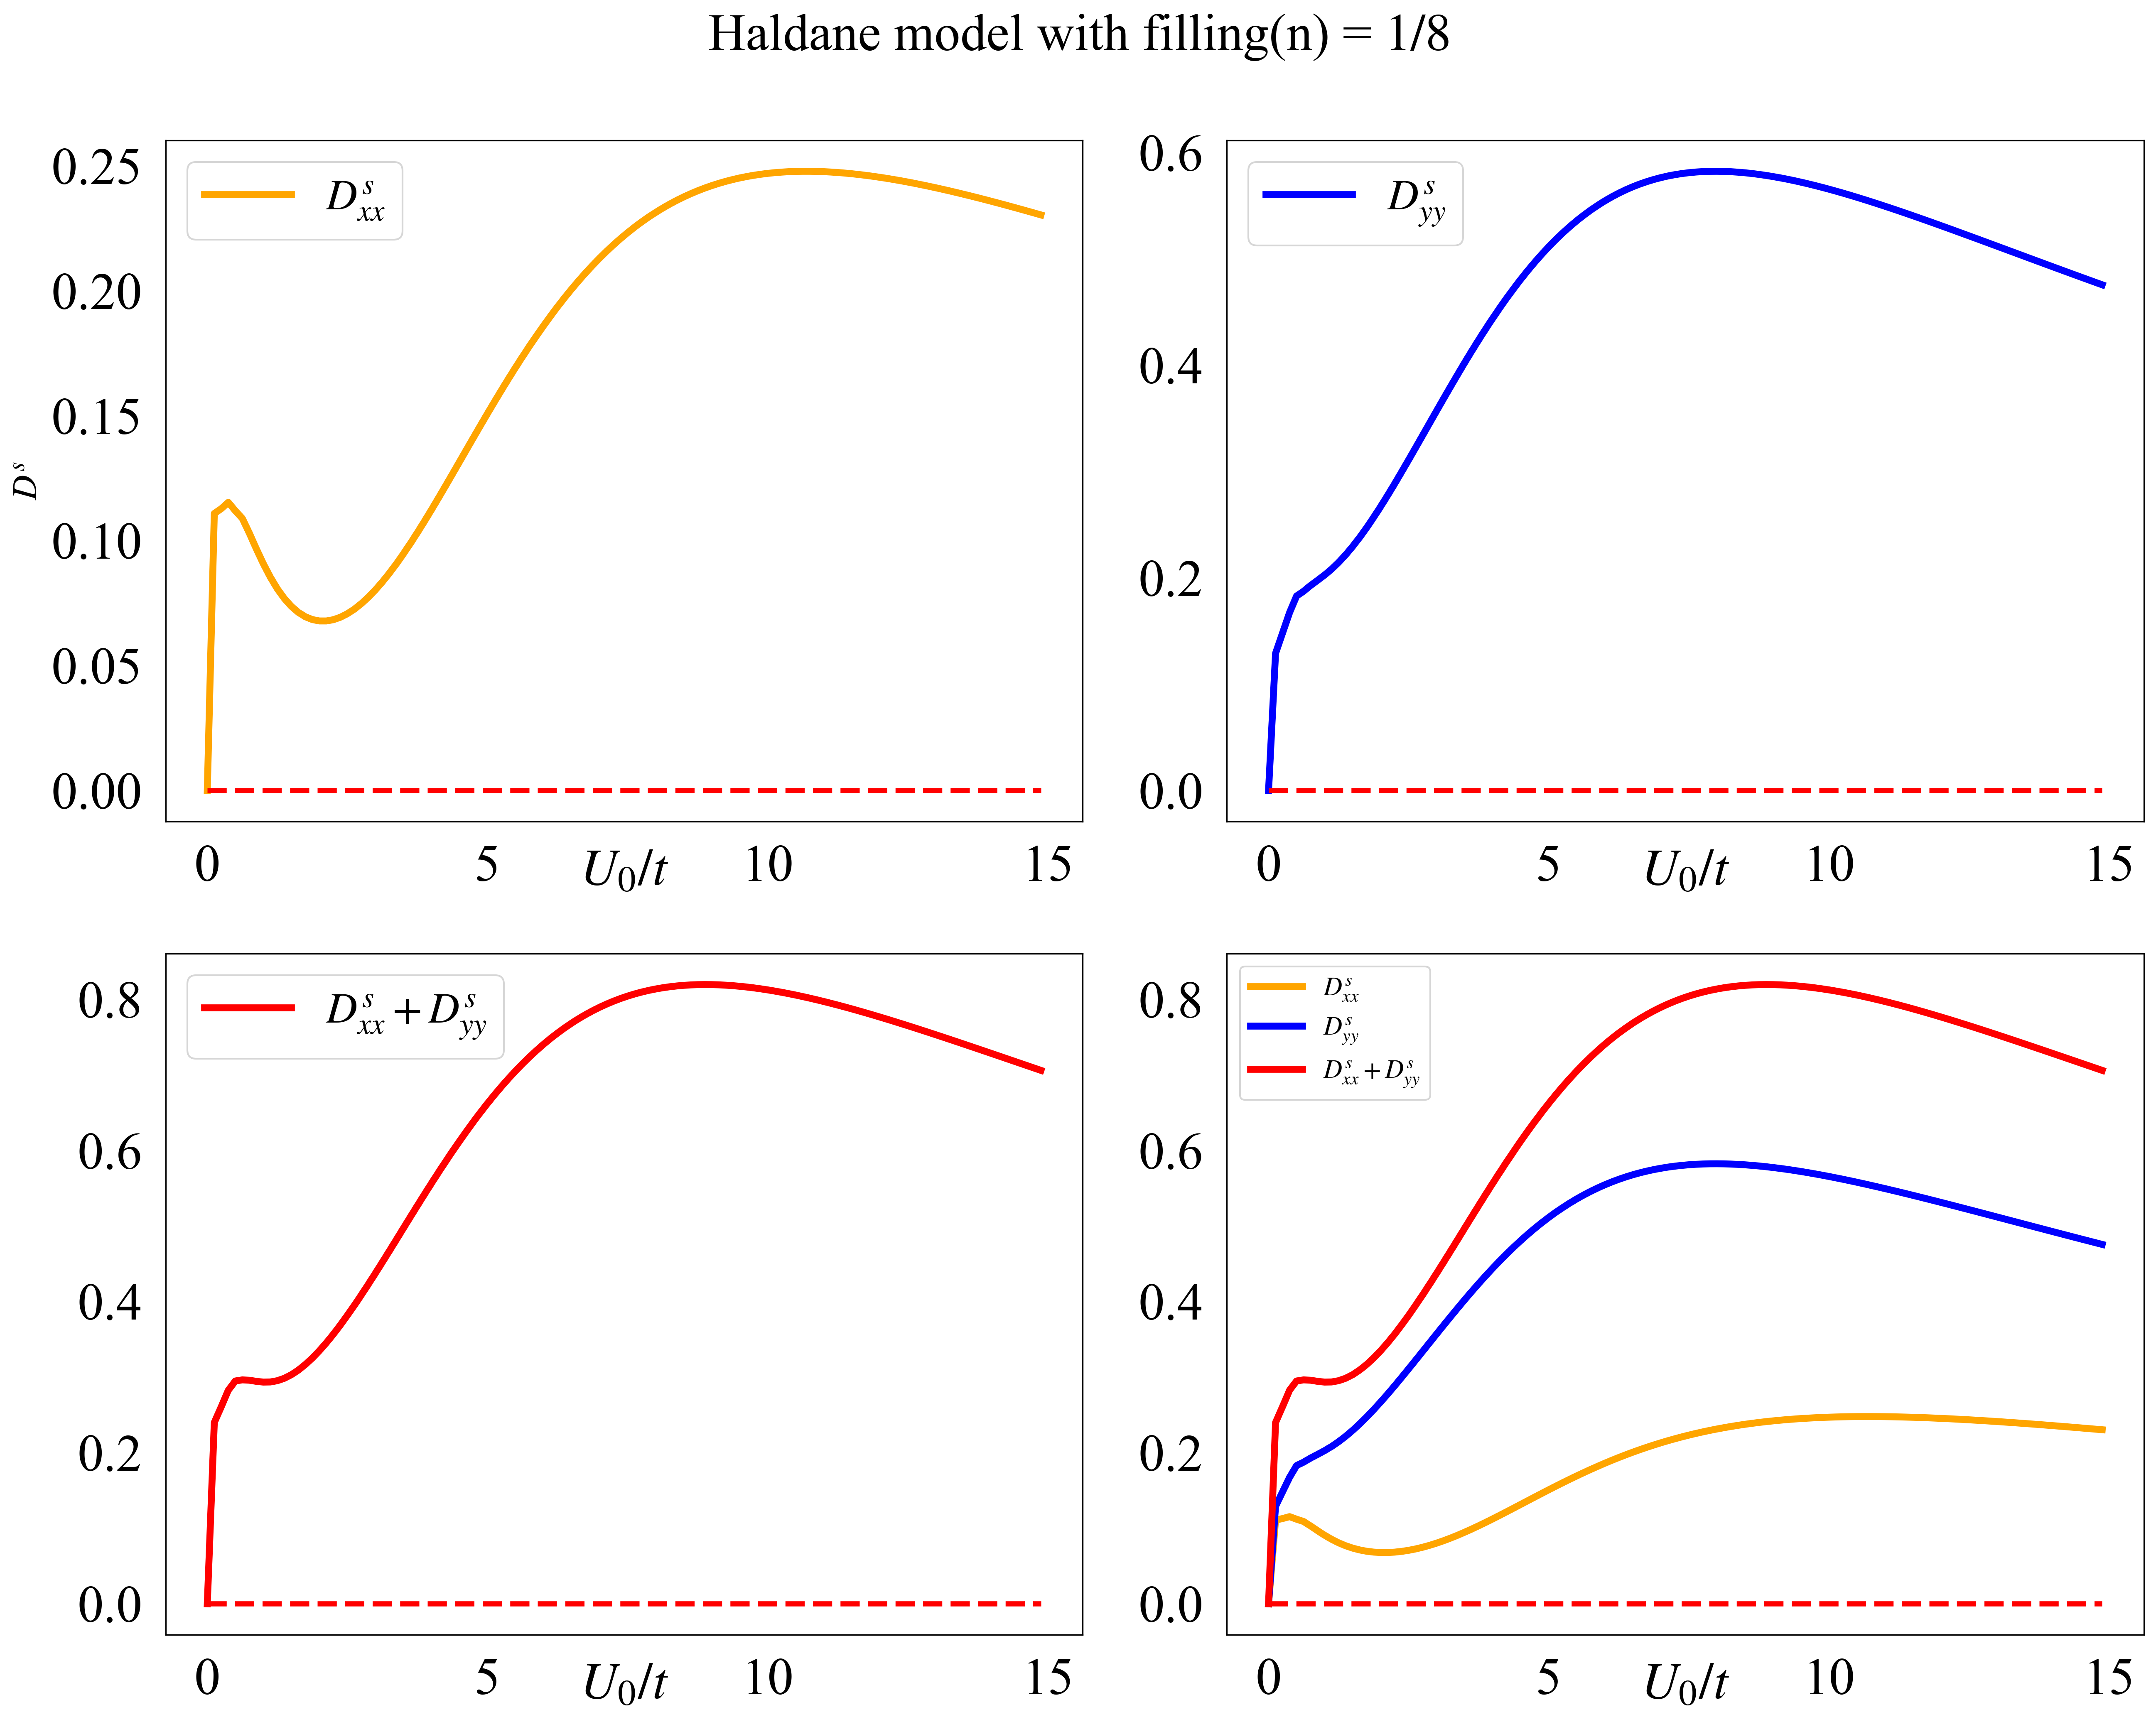
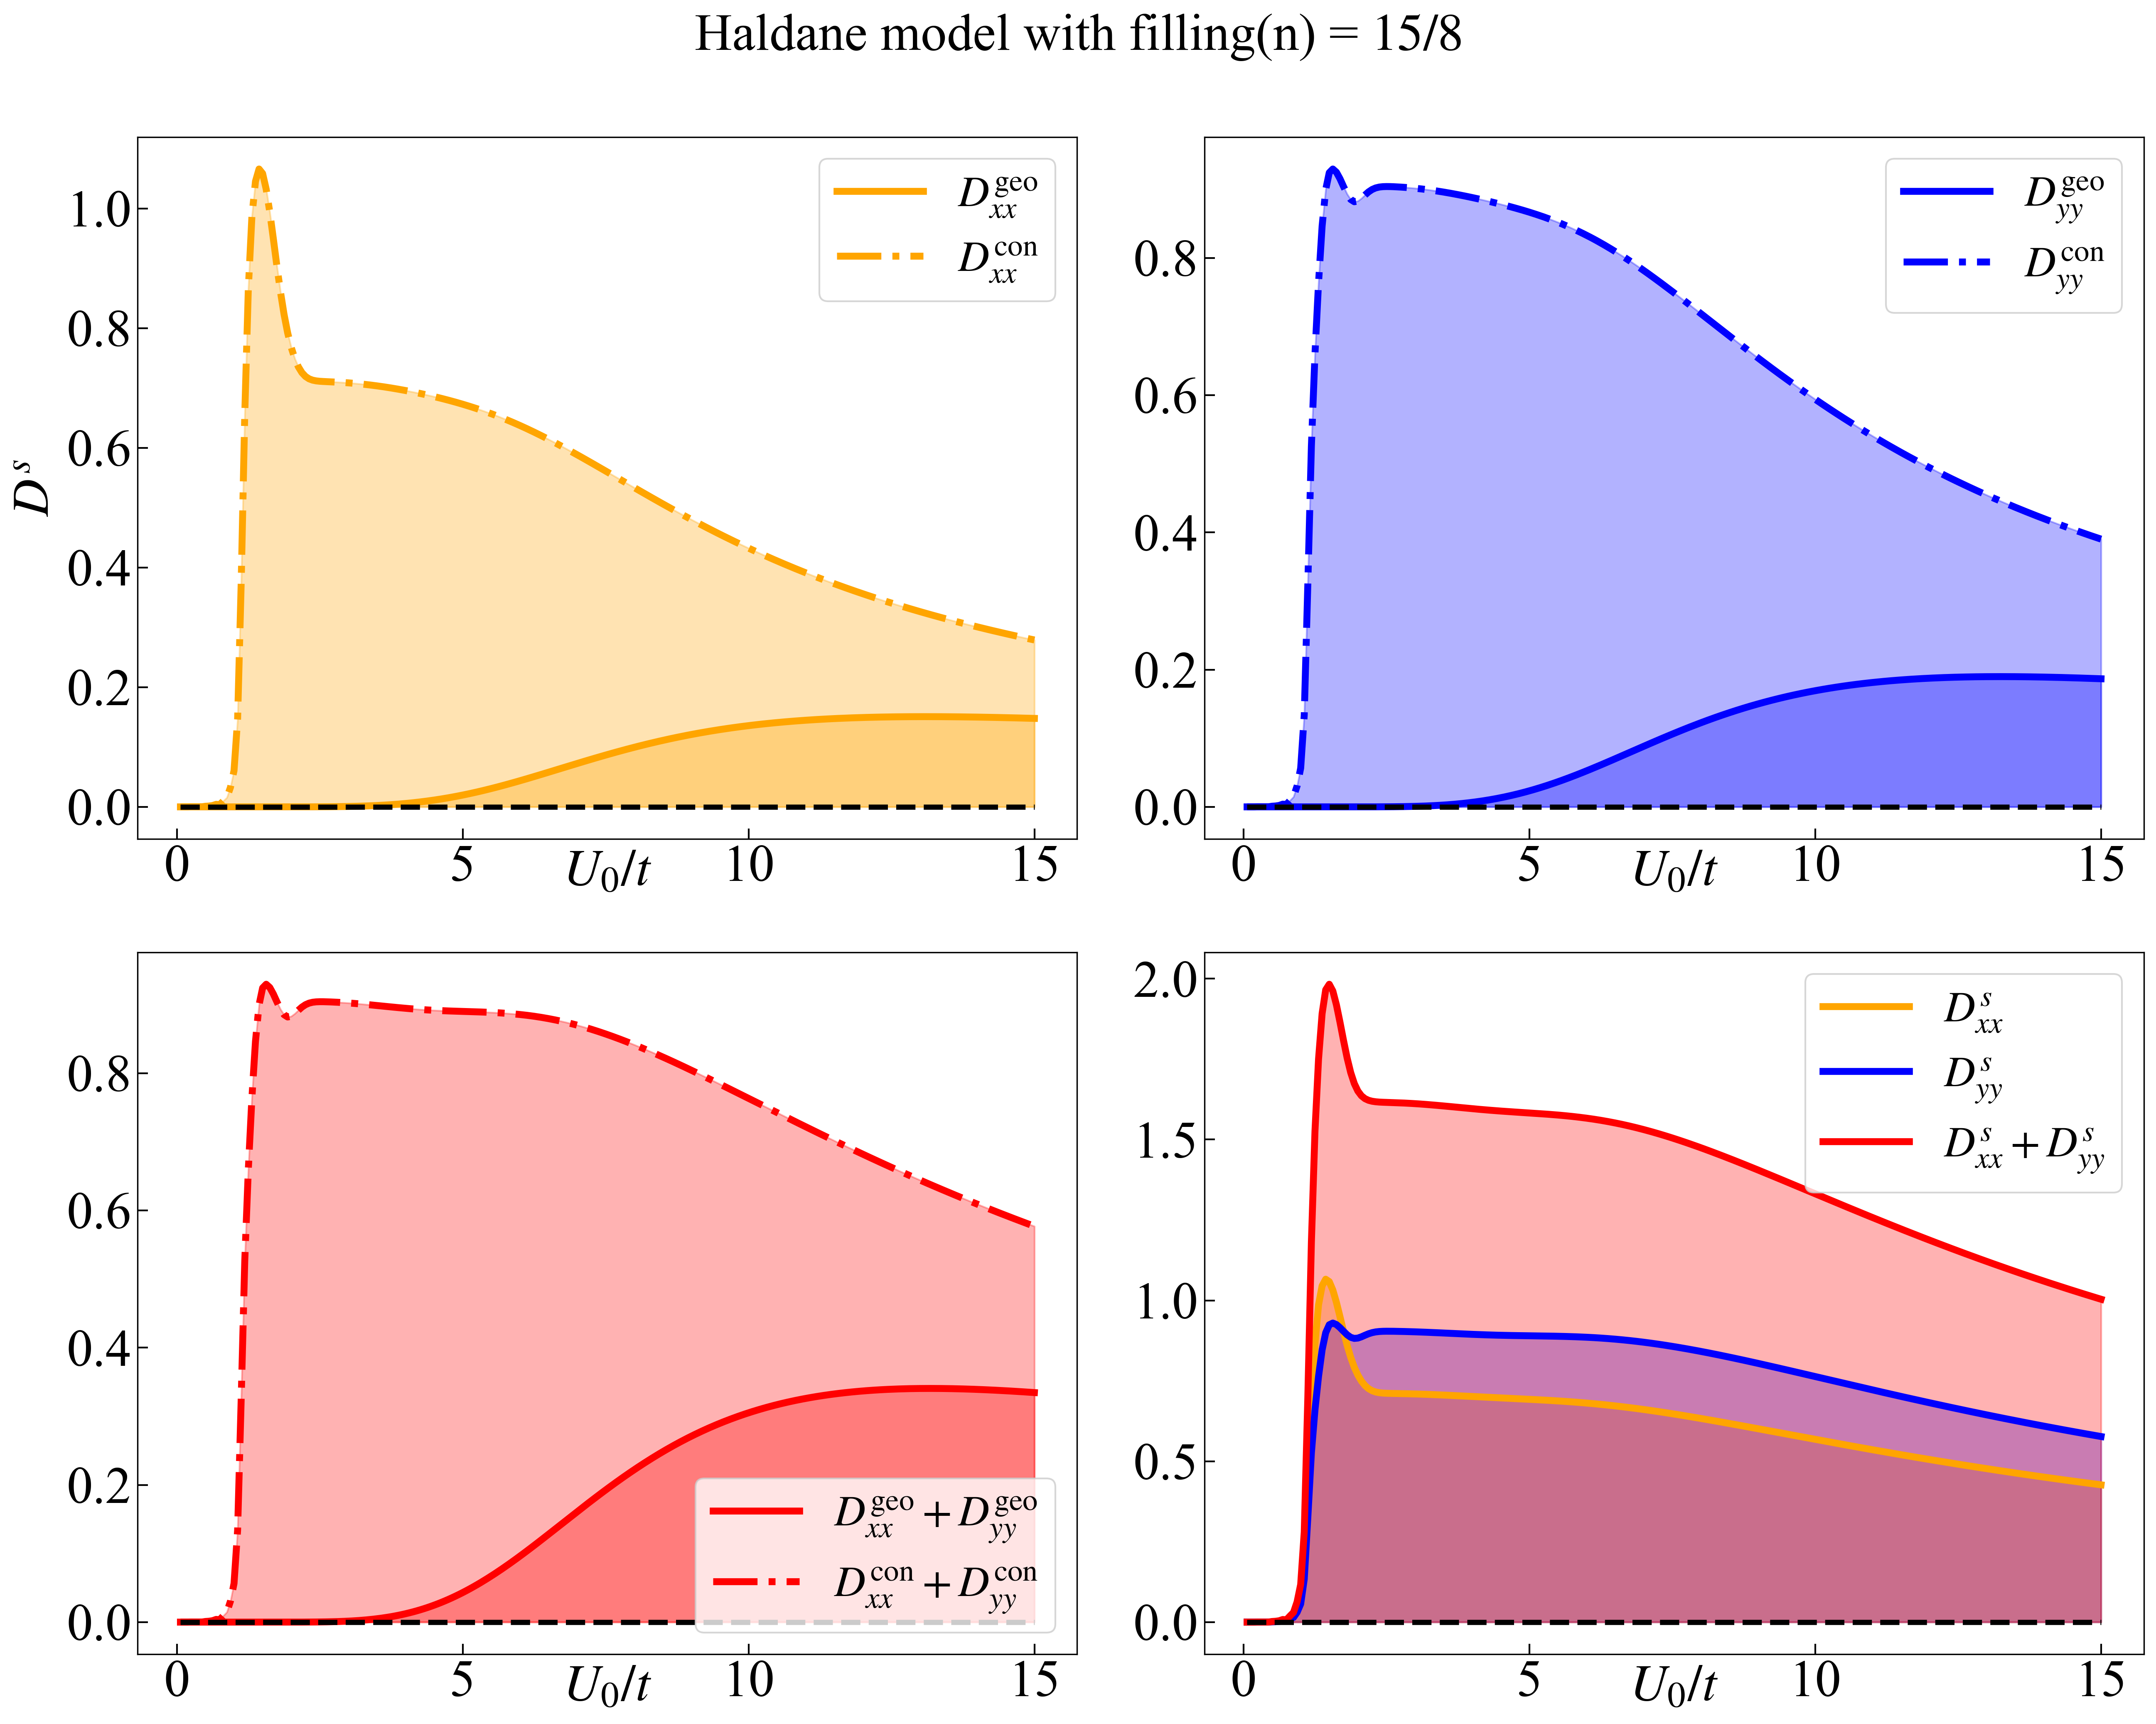
曲线填充
1 | import numpy as np |
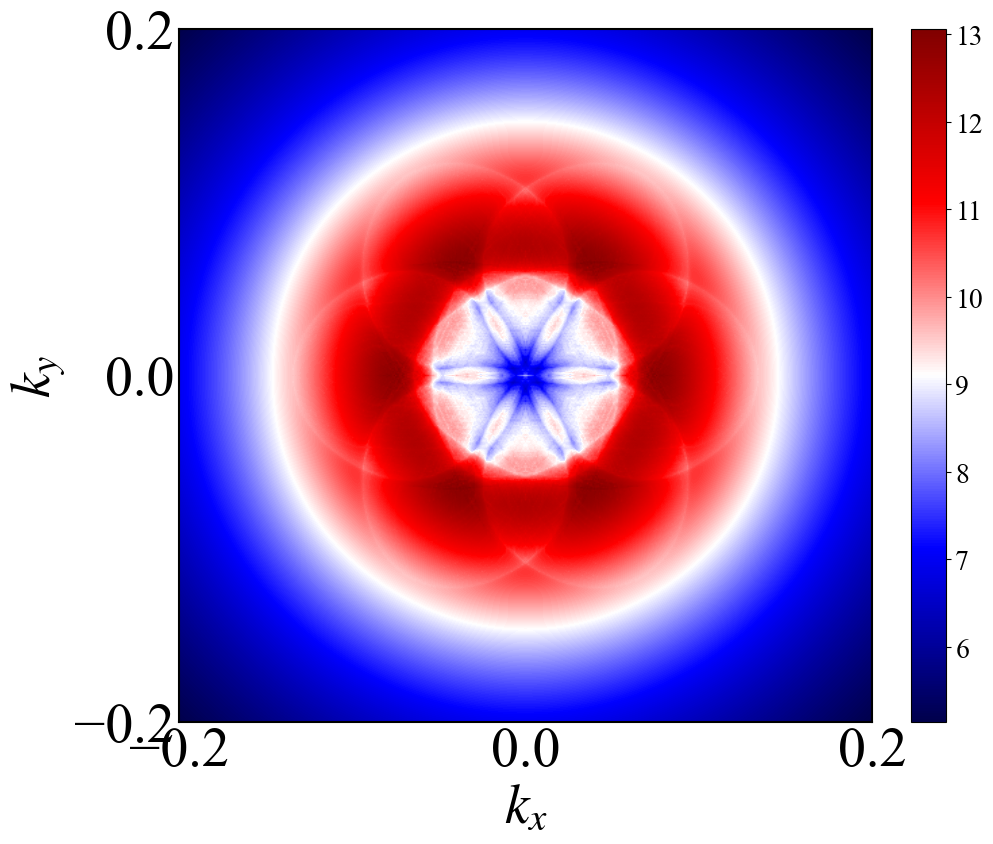
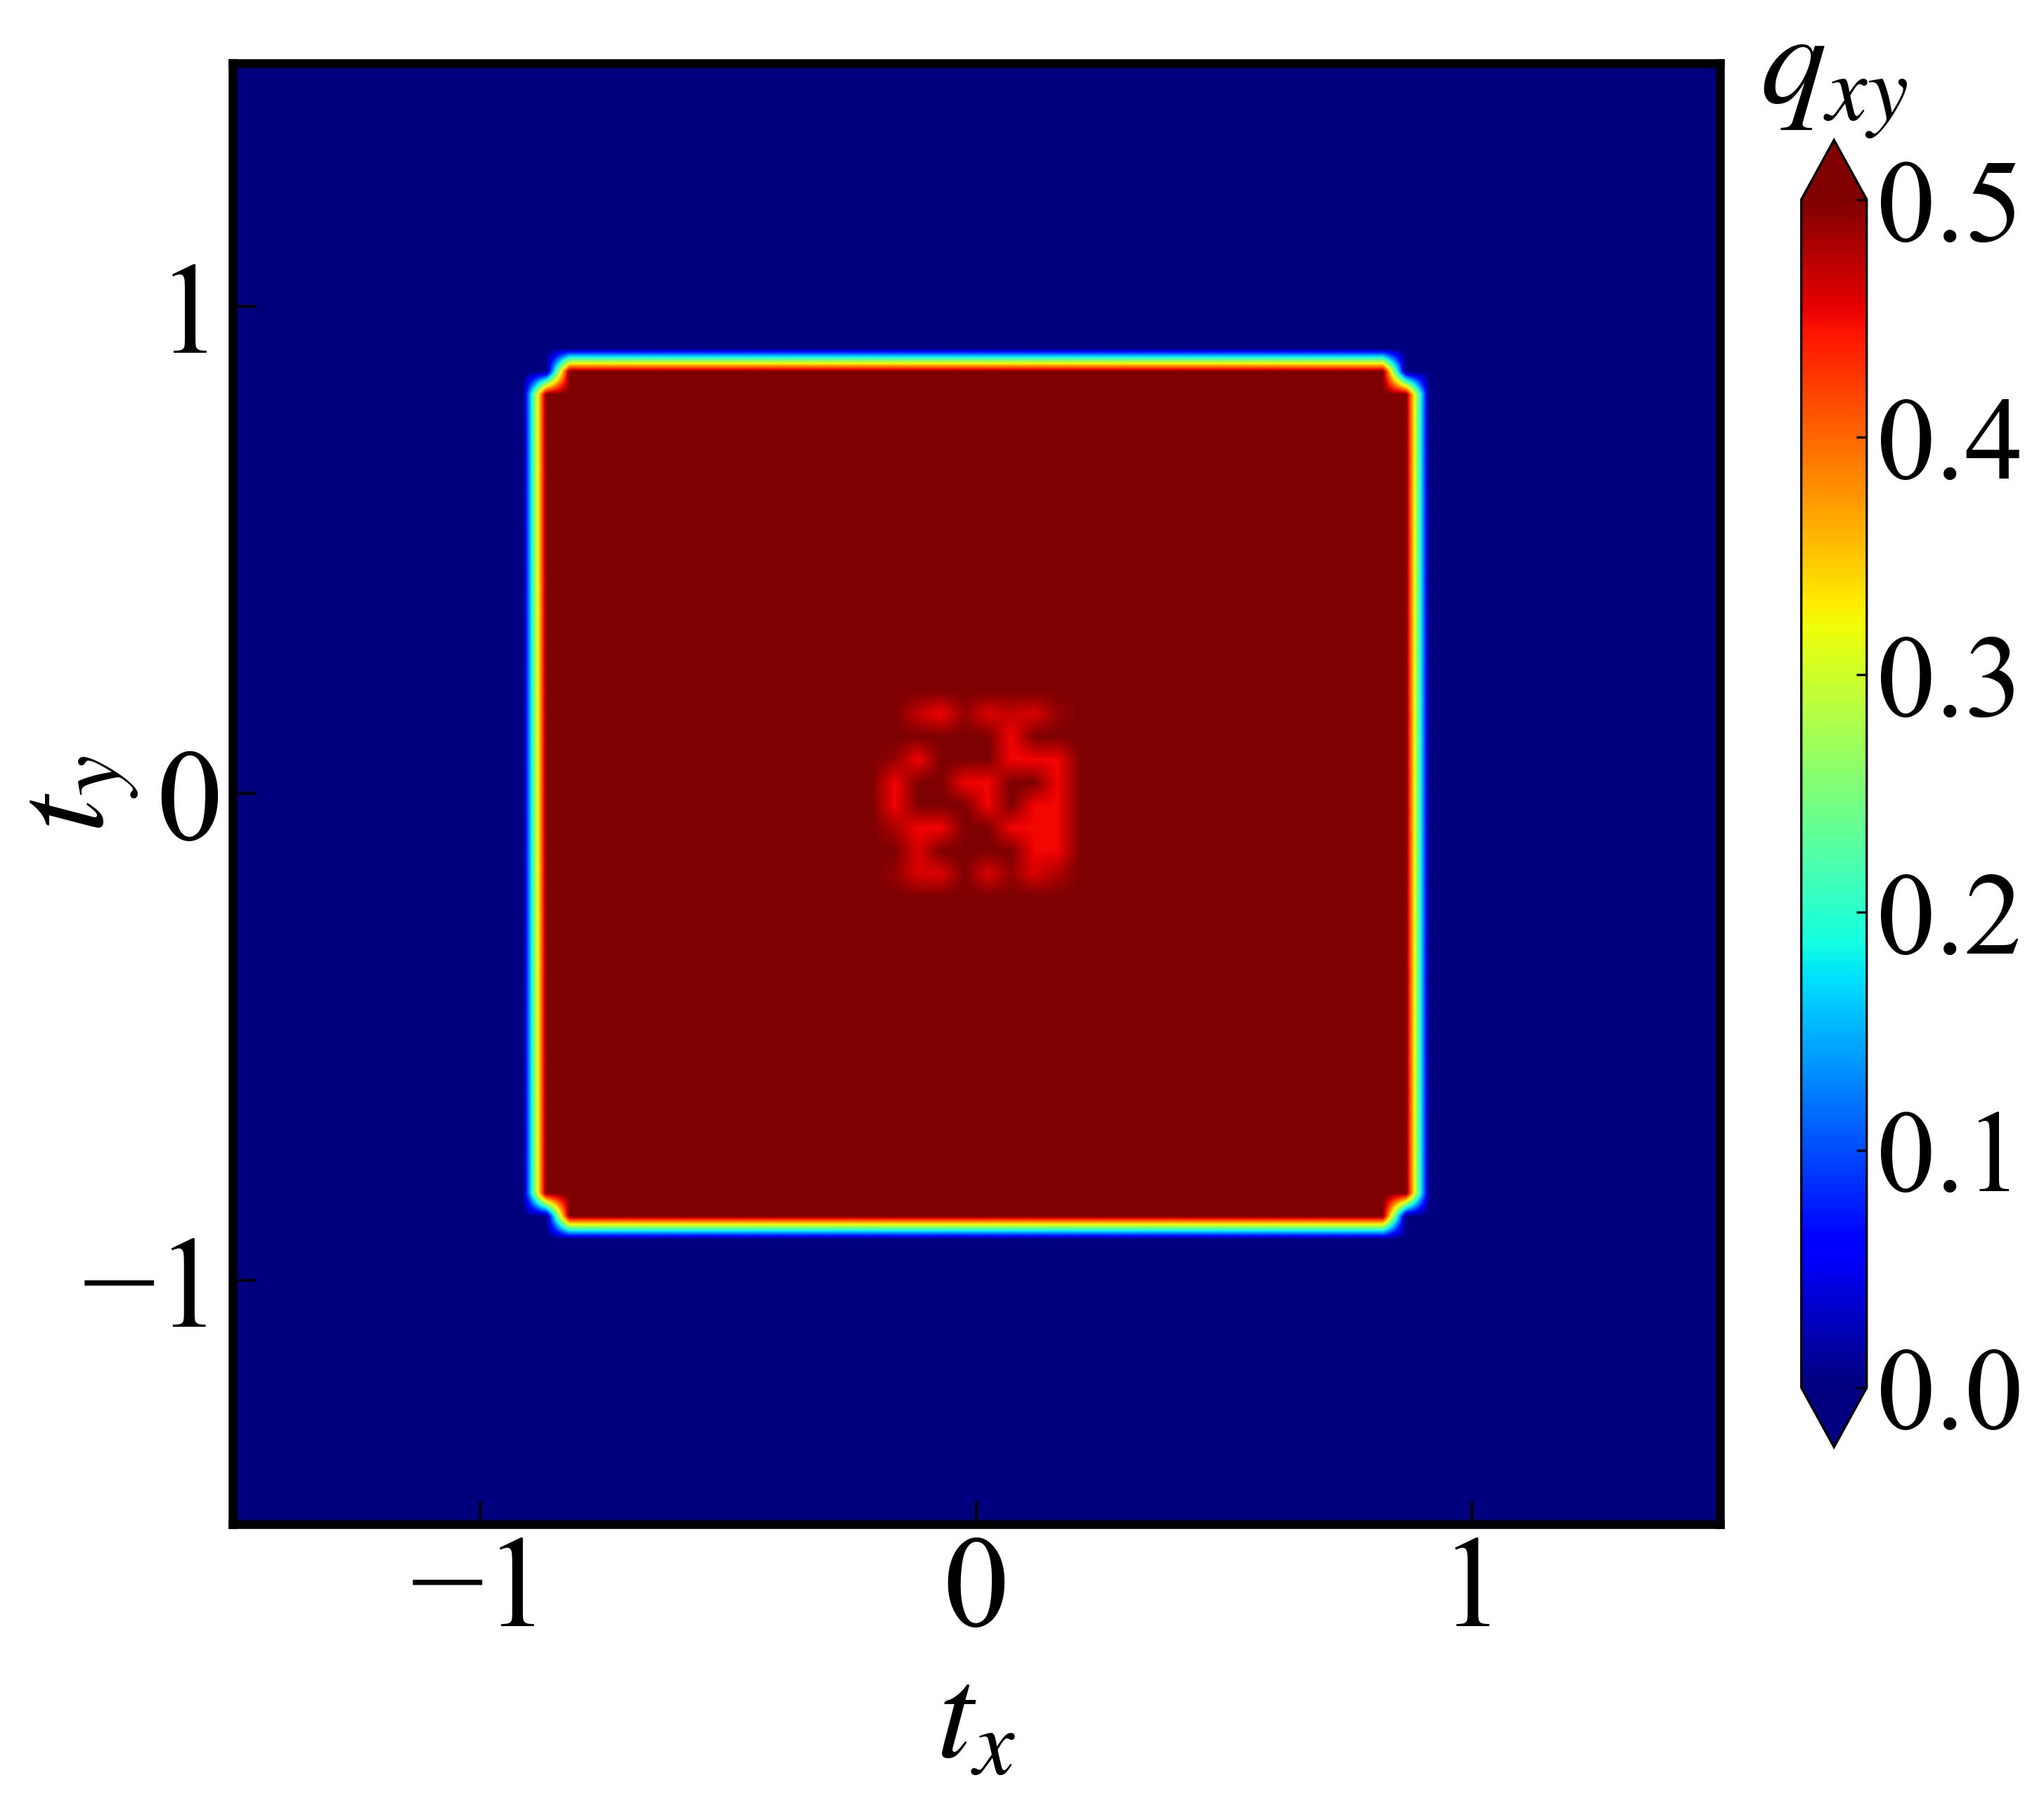
密度图3
1 | import numpy as np |
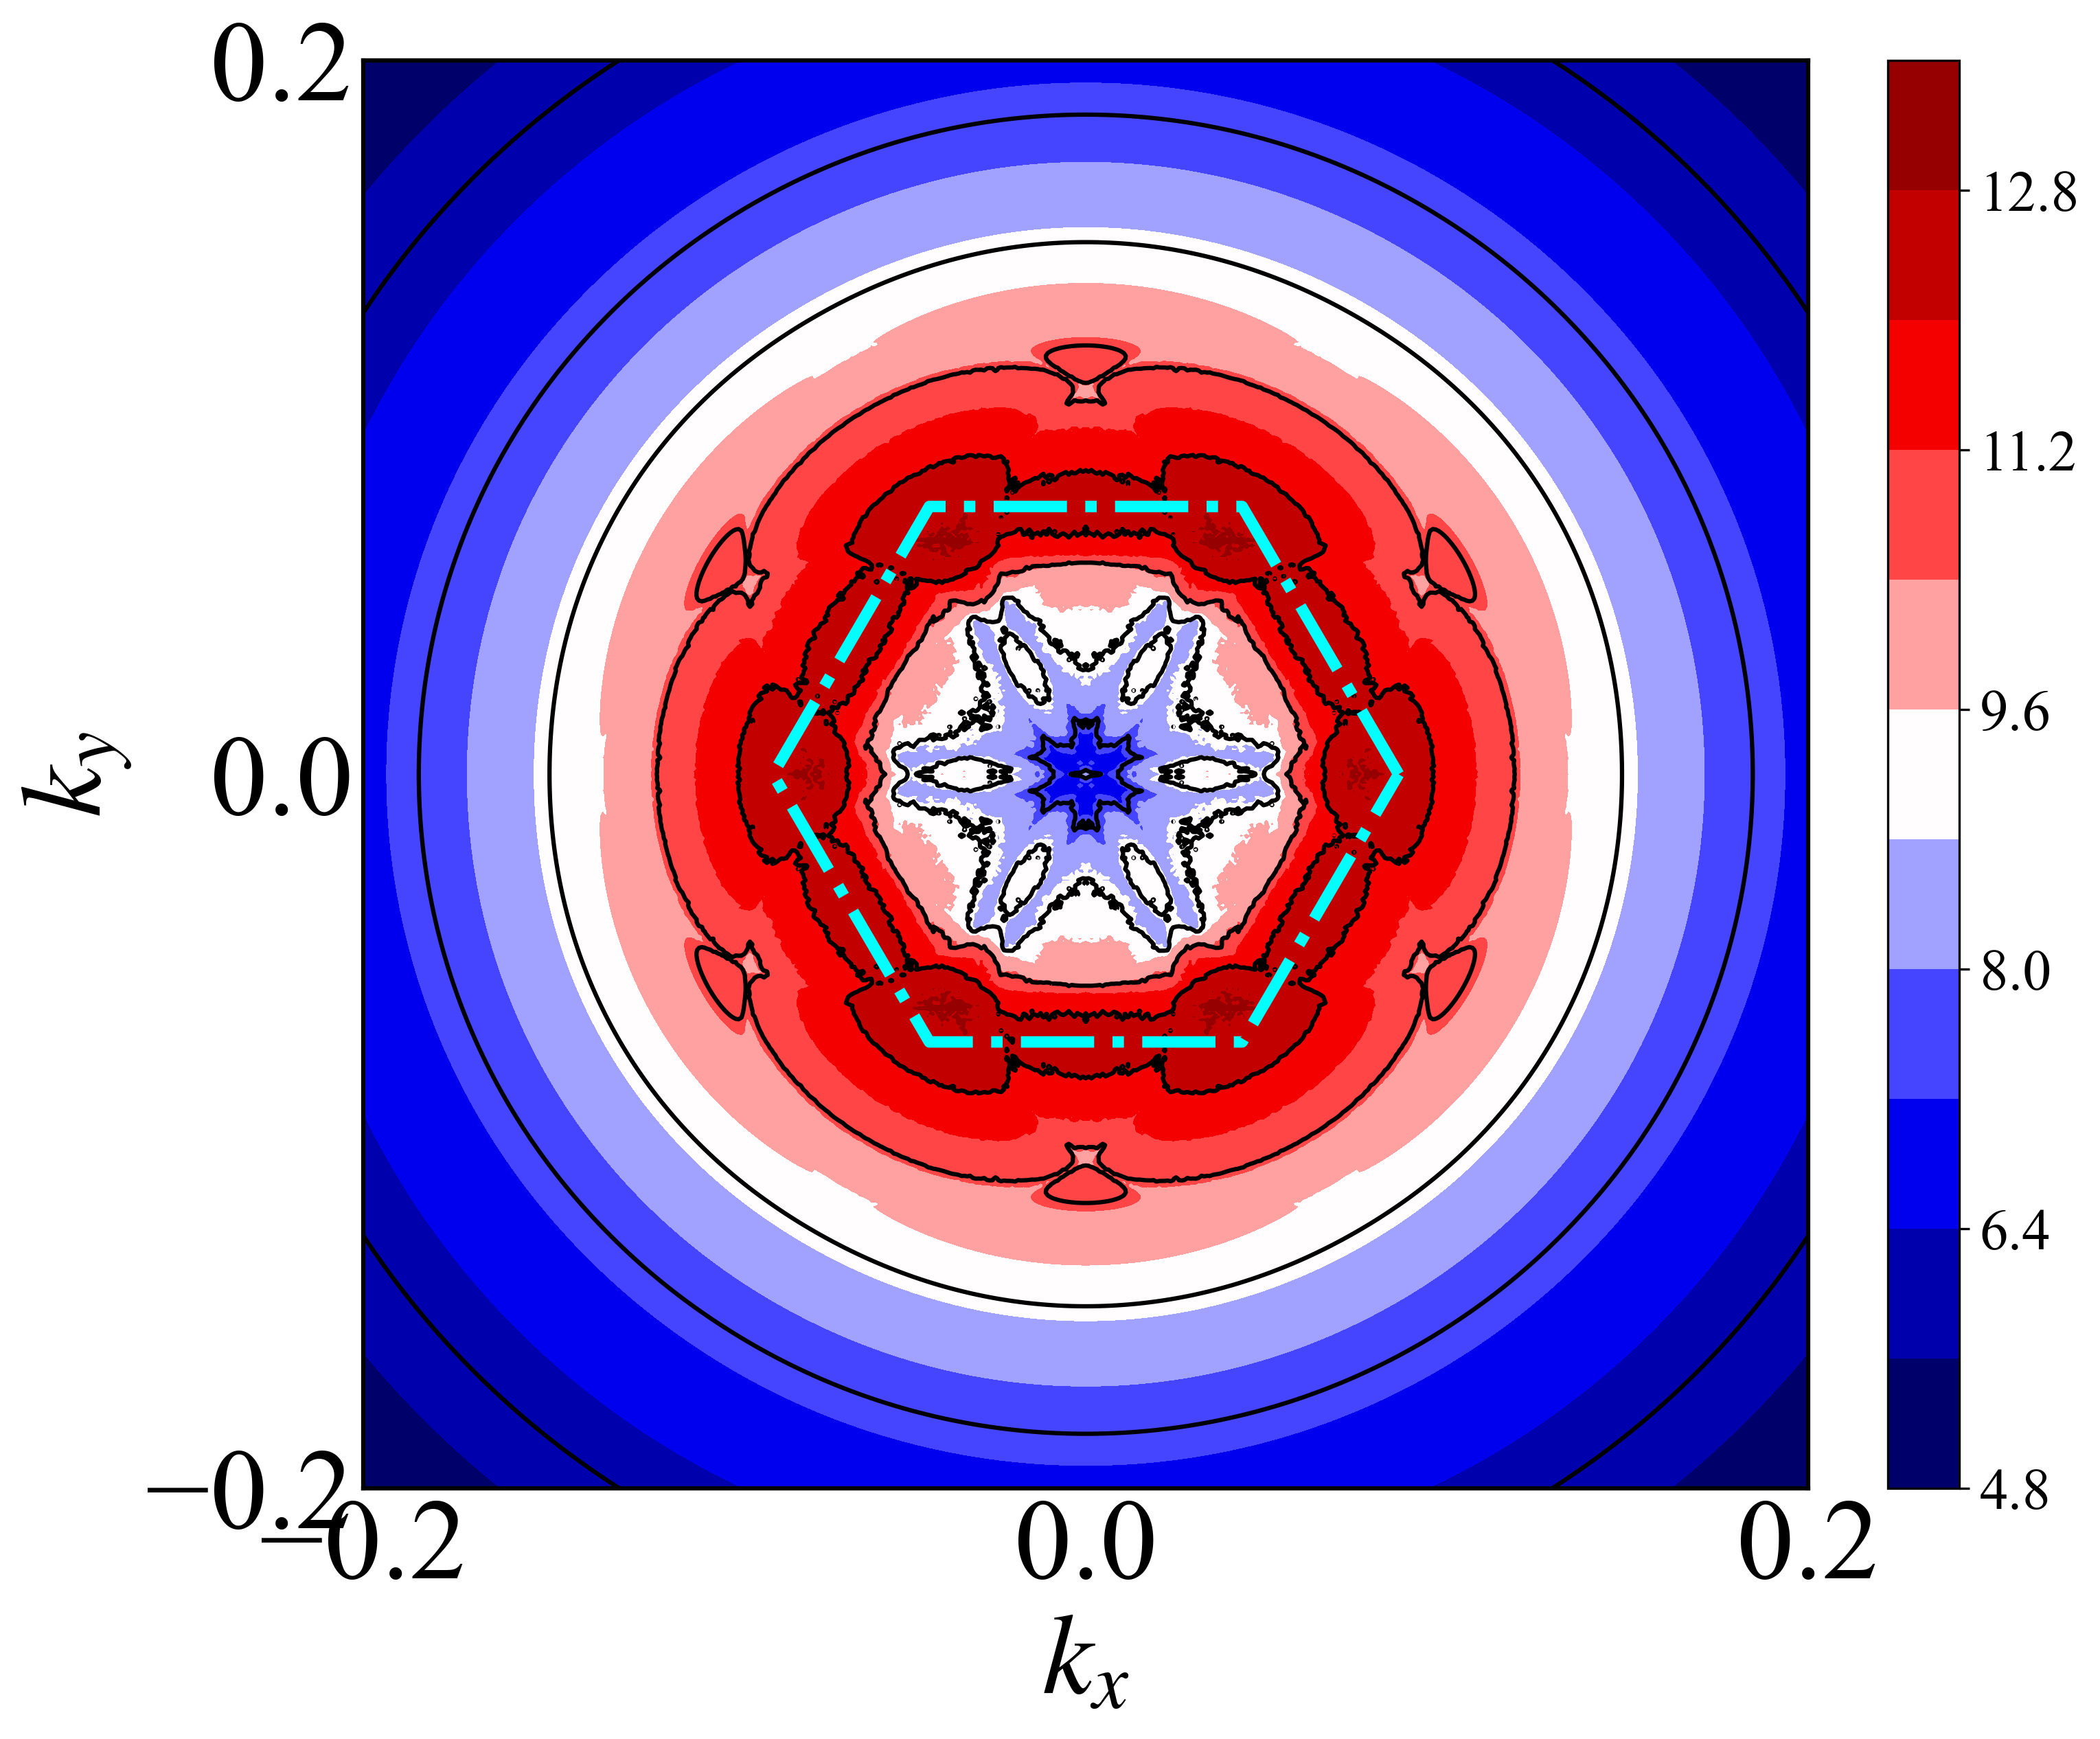
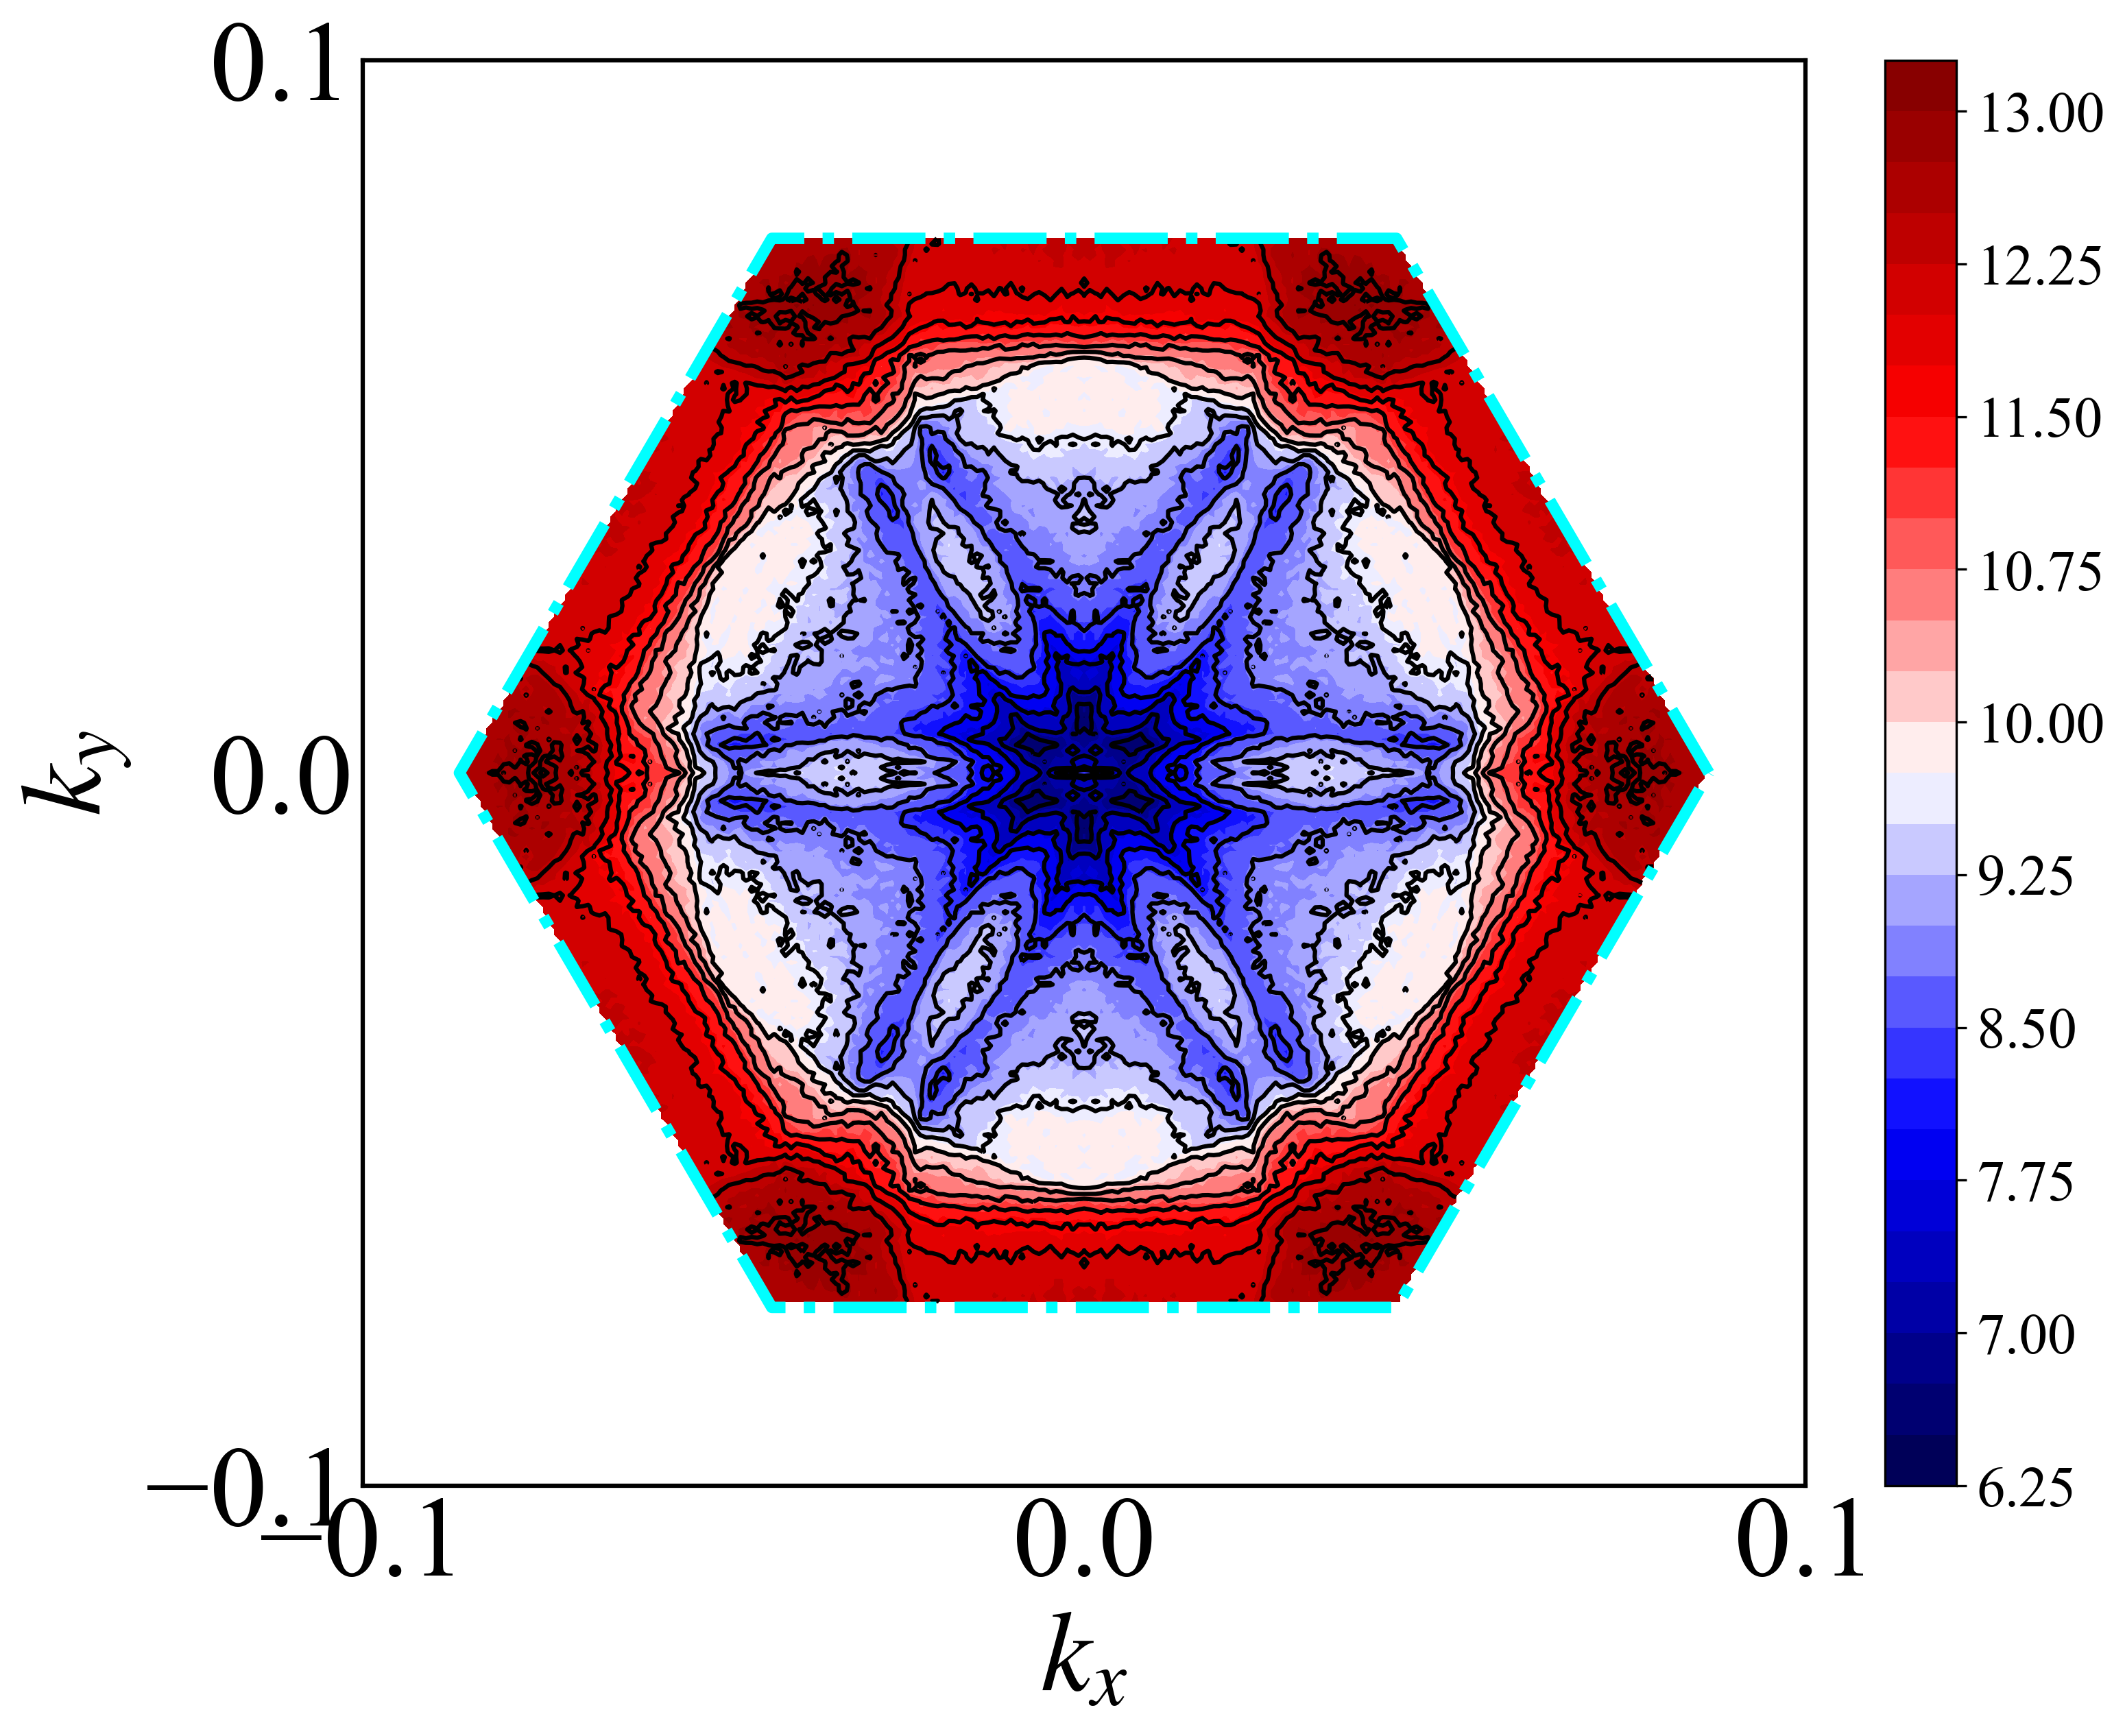
密度等高线图
1 | import numpy as np |
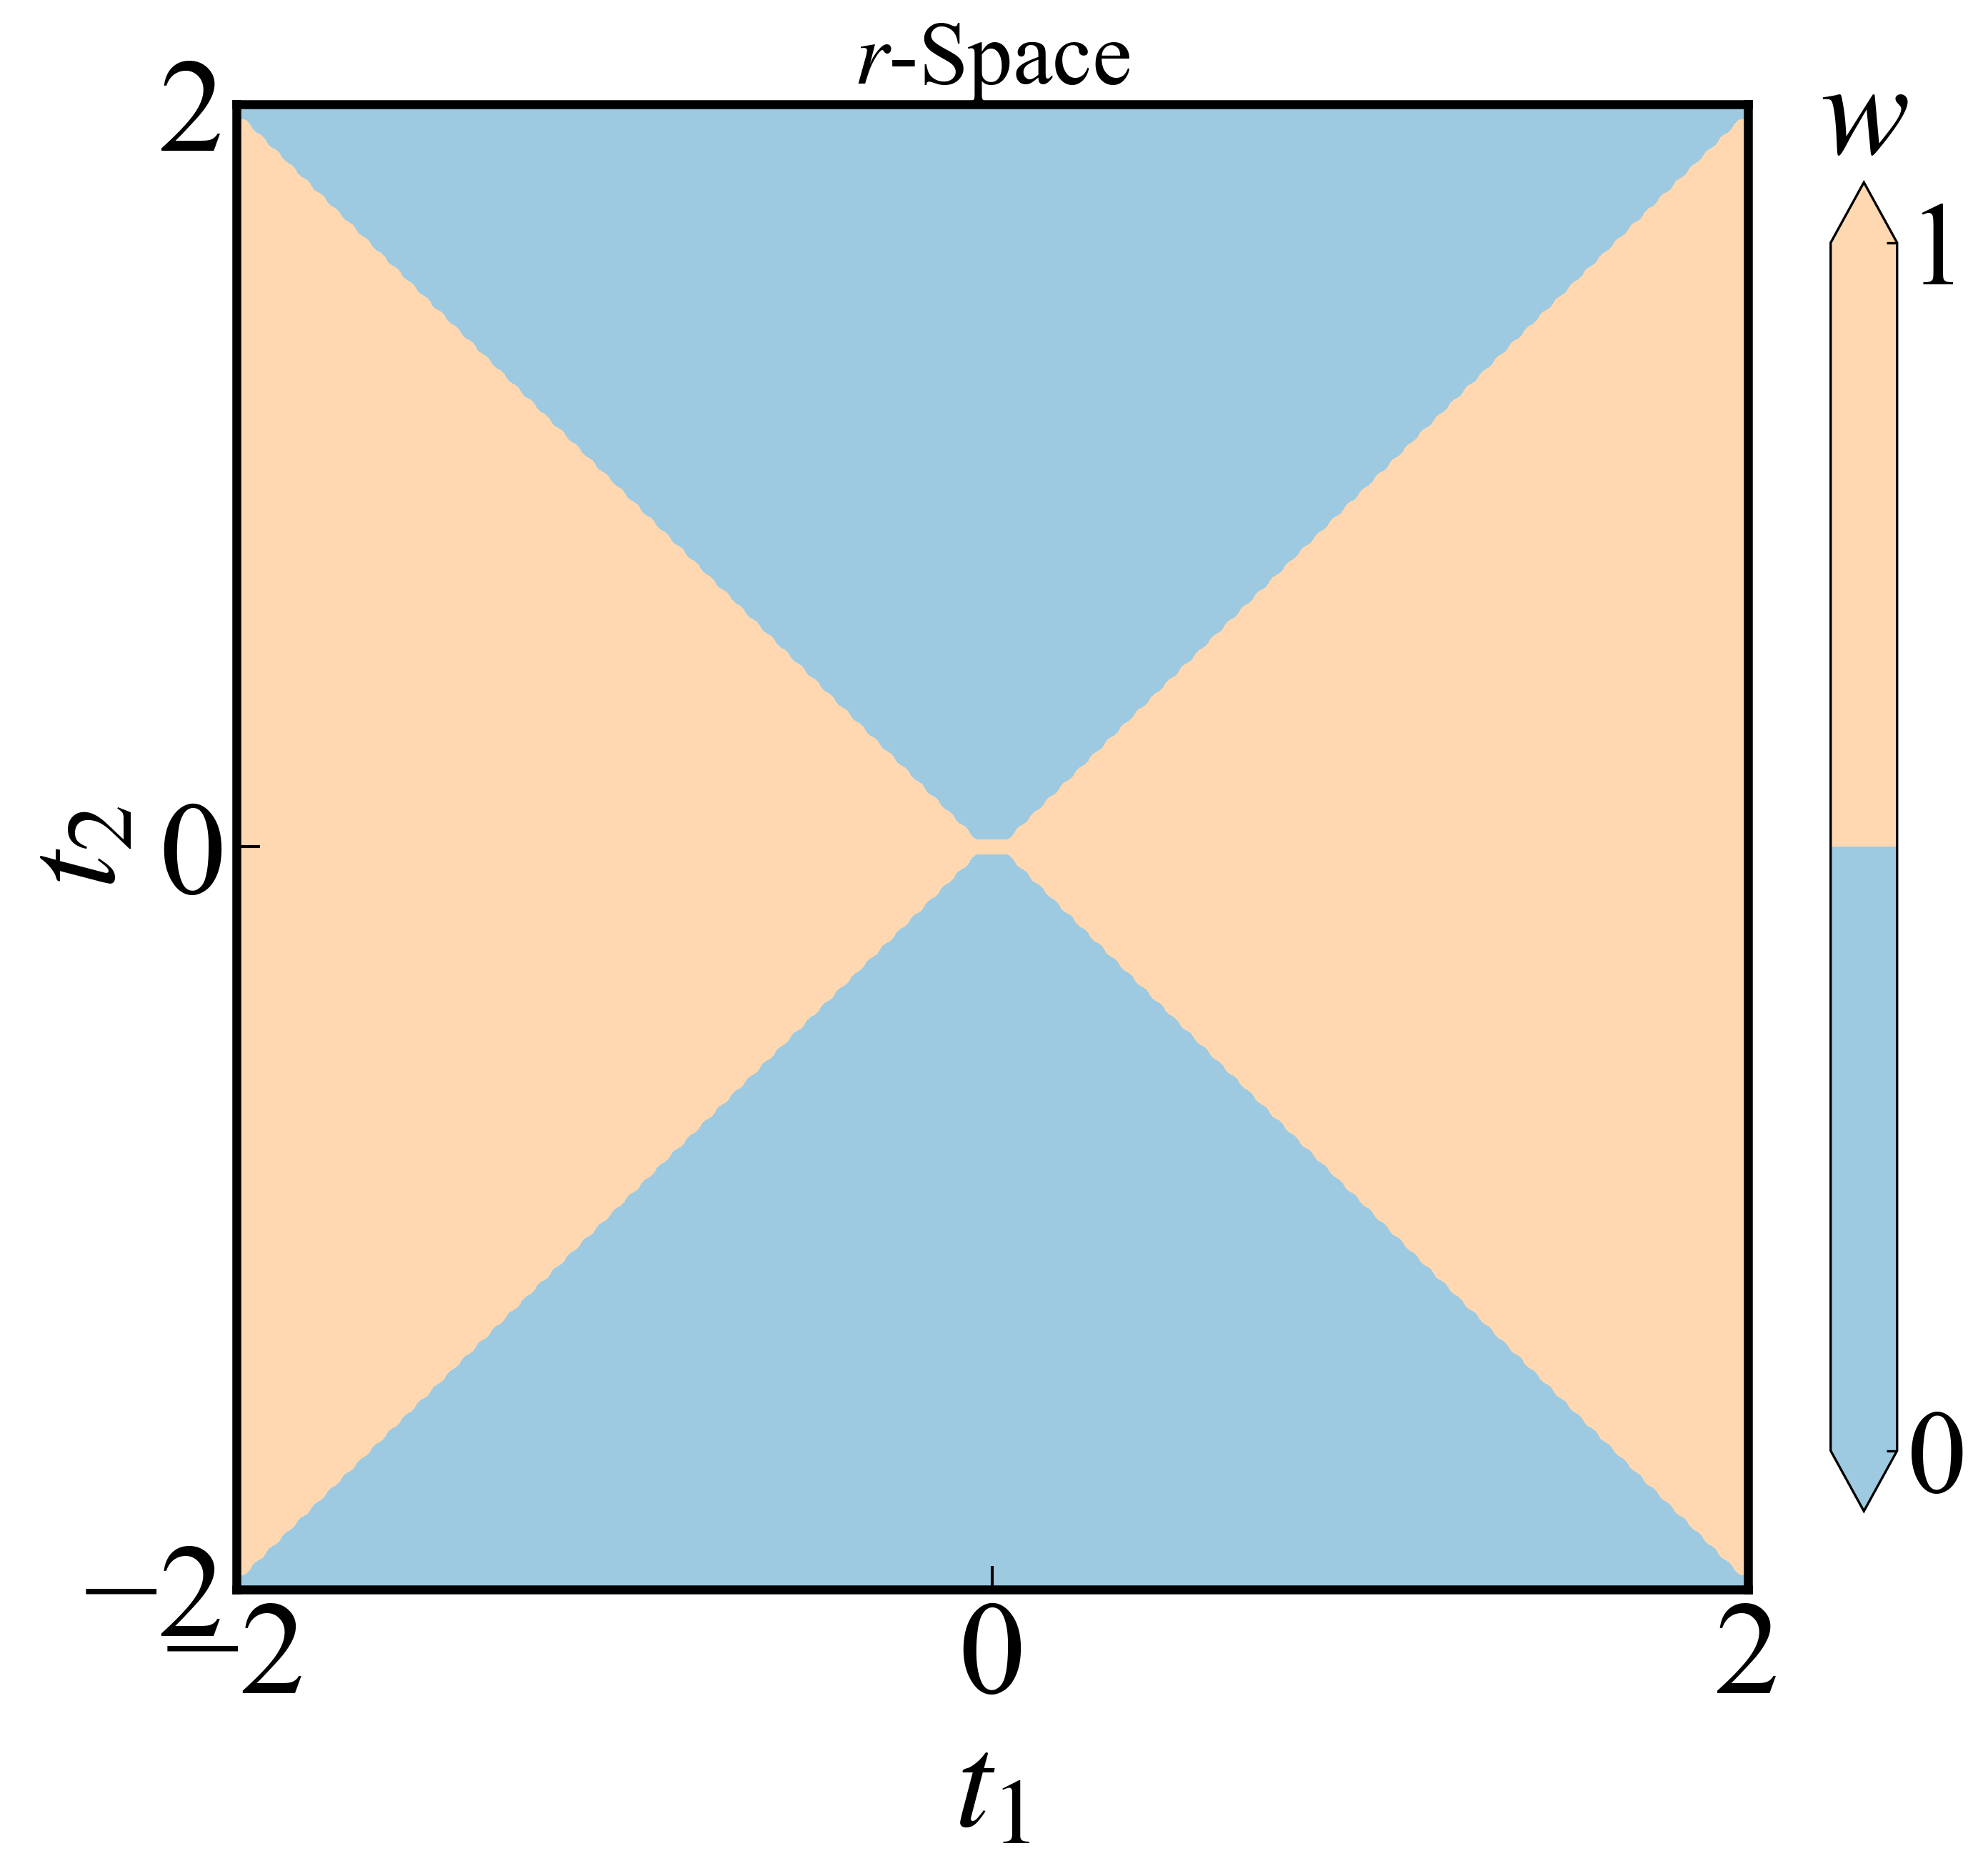
限制绘图区域
1 | def plotVscr3(): |
费米点+矢量箭头
数据生成代码1
2
3
4
5
6
7
8
9
10
11
12
13
14
15
16
17
18
19
20
21
22
23
24
25
26
27
28
29
30
31
32
33
34
35
36
37
38
39
40
41
42
43
44
45module code_param
implicit none
integer, parameter :: dp = kind(1.0)
real(dp),parameter::pi = acos(-1.0)
complex(dp),parameter::im = (0.,1.) ! Imagine unit
real(dp) delta_E
integer nkx,nky,ne
parameter(delta_E = 1e-4,nkx = 301,nky = 101,ne = 10)
end module code_param
!==============================================================================================================================================================
program main
use code_param
implicit none
call Gas_2D()
stop
end program main
!==============================================================================================================================================================
subroutine Gas_2D()
! 自由电子气测试
use code_param
implicit none
real(dp) t0,ek,kx,ky,mu
integer kn,ikx,iky,ik0
kn = 50
mu = 0.0
t0 = 1.0
open(30,file = "FS.dat")
open(31,file = "Arrow.dat")
do ikx = -kn,kn
do iky = -kn,kn
kx = pi * ikx/kn
ky = pi * iky/kn
ek = -t0 * (cos(kx) + cos(ky))
if(abs(ek - mu) .le. delta_E)then
write(30,"(20F15.8)")kx,ky,ek,sin(kx),sin(ky),sin(kx + ky),sqrt(sin(kx)**2 + sin(ky)**2)
end if
if(abs(ek - mu) .le. 1e-3 * delta_E)then
write(31,"(20F15.8)")kx,ky,ek,sin(kx),sin(ky),sin(kx + ky),sqrt(sin(kx)**2 + sin(ky)**2)
end if
end do
end do
close(30)
close(31)
end subroutine
绘图代码1
2
3
4
5
6
7
8
9
10
11
12
13
14
15
16
17
18
19
20
21
22
23
24
25
26
27
28
29
30
31
32
33
34
35
36
37
38
39
40
41
42
43
44
45
46
47
48
49
50
51
52
53
54
55
56
57
58
59
60
61
62
63
64
65
66
67
68
69
70
71
72
73
74
75
76
77
78
79
80
81
82
83
84
85
86
87
88
89
90
91
92
93
94
95
96
97
98
99
100
101
102
103
104
105
106
107
108
109
110
111import numpy as np
import matplotlib.pyplot as plt
from matplotlib import rcParams
import os
import matplotlib.gridspec as gridspec
from matplotlib.path import Path
import matplotlib.colors as mcolors
plt.rc('font', family='Times New Roman')
config = {
"font.size": 30,
"mathtext.fontset":'stix',
"font.serif": ['SimSun'],
}
rcParams.update(config) # Latex 字体设置
#------------------------------------------------------------------------------------------------------------------------------------------------------------------------------
def plotfs():
# 简单绘制个费米面
dataname = "FS.dat"
picname = os.path.splitext(dataname)[0] + ".png"
da = np.loadtxt(dataname)
plt.figure(figsize = (10,8))
# pair = da2[:,con1 - 1]
pair = da[:,4]
vmin, vmax = np.min(pair), np.max(pair)
norm = mcolors.TwoSlopeNorm(vmin = vmin, vcenter = 0, vmax = vmax)
sc = plt.scatter(da[:,0],da[:,1], c = da[:,4] ,s = 5, cmap = "seismic")
# sc = plt.scatter(da[:,0],da[:,1], c = da[:,3] ,s = 5, cmap = "seismic",norm = norm)
cb = plt.colorbar(sc,fraction = 0.1,ticks = [np.min(pair),0,np.max(pair)],extend='both',label = r"$\lambda$") # 调整colorbar的大小和图之间的间距
cb.ax.tick_params(size = 0)
cb.ax.set_yticklabels([format(np.min(pair),".1f"), format(0,".1f"),format(np.max(pair),".1f")])
valx = 0.5
valy = 0.5
plt.xlim(-valx,valx)
plt.ylim(-valy,valy)
plt.tick_params(direction = 'in' ,axis = 'x',width = 0,length = 10)
plt.tick_params(direction = 'in' ,axis = 'y',width = 0,length = 10)
# plt.axis('scaled')
ax = plt.gca()
ax.spines["bottom"].set_linewidth(1.5)
ax.spines["left"].set_linewidth(1.5)
ax.spines["right"].set_linewidth(1.5)
ax.spines["top"].set_linewidth(1.5)
# plt.show()
plt.savefig(picname, dpi = 300,bbox_inches = 'tight')
plt.close()
#------------------------------------------------------------------------------------------------------------------------------------------------------------------------------
def plotfs_2():
# 绘制有颜色的
da1 = "FS.dat"
da2 = "Arrow.dat"
# picname = os.path.splitext(da1)[0] + ".png"
picname = "Results.png"
da1 = np.loadtxt(da1)
da2 = np.loadtxt(da2)
plt.figure(figsize = (10,8))
# pair = da2[:,con1 - 1]
pair = da1[:,4]
vmin, vmax = np.min(pair), np.max(pair)
norm = mcolors.TwoSlopeNorm(vmin = vmin, vcenter = 0, vmax = vmax)
sc = plt.scatter(da1[:,0],da1[:,1], c = da1[:,4] ,s = 5, cmap = "seismic")
# sc = plt.scatter(da[:,0],da[:,1], c = da[:,3] ,s = 5, cmap = "seismic",norm = norm)
cb = plt.colorbar(sc,fraction = 0.1,ticks = [np.min(pair),0,np.max(pair)],extend='both',label = r"$\lambda$") # 调整colorbar的大小和图之间的间距
cb.ax.tick_params(size = 0)
cb.ax.set_yticklabels([format(np.min(pair),".1f"), format(0,".1f"),format(np.max(pair),".1f")])
#----------------
# 矢量起点坐标 (kx,ky)
x0 = np.array(da2[:,0])
y0 = np.array(da2[:,1])
# 矢量方向(v0,u0)
v0 = np.array(da2[:,2]) * 10 # 向量场方向
u0 = np.array(da2[:,3]) * 10
magnitude = da2[:,5] # 控制箭头颜色
# plt.quiver(x0, y0, v0, u0, color='b', angles='xy', scale_units='xy', scale=2)
sc = plt.quiver(x0, y0, v0, u0, magnitude, cmap = 'plasma', angles='xy', scale_units='xy', scale = 10)
# vmin, vmax = np.min(magnitude), np.max(magnitude)
# norm = mcolors.TwoSlopeNorm(vmin = vmin, vcenter = 0, vmax = vmax)
cb = plt.colorbar(sc,fraction = 0.1,ticks = [np.min(magnitude),0,np.max(magnitude)],extend='both',label = r"$s_z$") # 调整colorbar的大小和图之间的间距
cb.set_label(r"$s_z$", labelpad = -35) # 设置 labelpad 调整距离
cb.ax.tick_params(size = 0)
cb.ax.set_yticklabels([format(np.min(magnitude),".1f"), format(0,".1f"),format(np.max(magnitude),".1f")])
# plt.quiver(x0, y0, v0, u0, magnitude, cmap='seismic', scale = 5)
# xtic = [-np.pi,0,np.pi]
# xticlab = ["$-\pi$","$0$","$\pi$"]
# plt.xticks(xtic,list(xticlab),fontproperties='Times New Roman', size = 40)
# plt.yticks(xtic,list(xticlab),fontproperties='Times New Roman', size = 40)
# valx = 0.5
# valy = 0.5
# plt.xlim(-valx,valx)
# plt.ylim(-valy,valy)
plt.tick_params(direction = 'in' ,axis = 'x',width = 0,length = 10)
plt.tick_params(direction = 'in' ,axis = 'y',width = 0,length = 10)
# plt.axis('scaled')
ax = plt.gca()
ax.spines["bottom"].set_linewidth(1.5)
ax.spines["left"].set_linewidth(1.5)
ax.spines["right"].set_linewidth(1.5)
ax.spines["top"].set_linewidth(1.5)
# plt.show()
plt.savefig(picname, dpi = 300,bbox_inches = 'tight')
plt.close()
#------------------------------------------------------------
if __name__=="__main__":
# plotfs()
plotfs_2()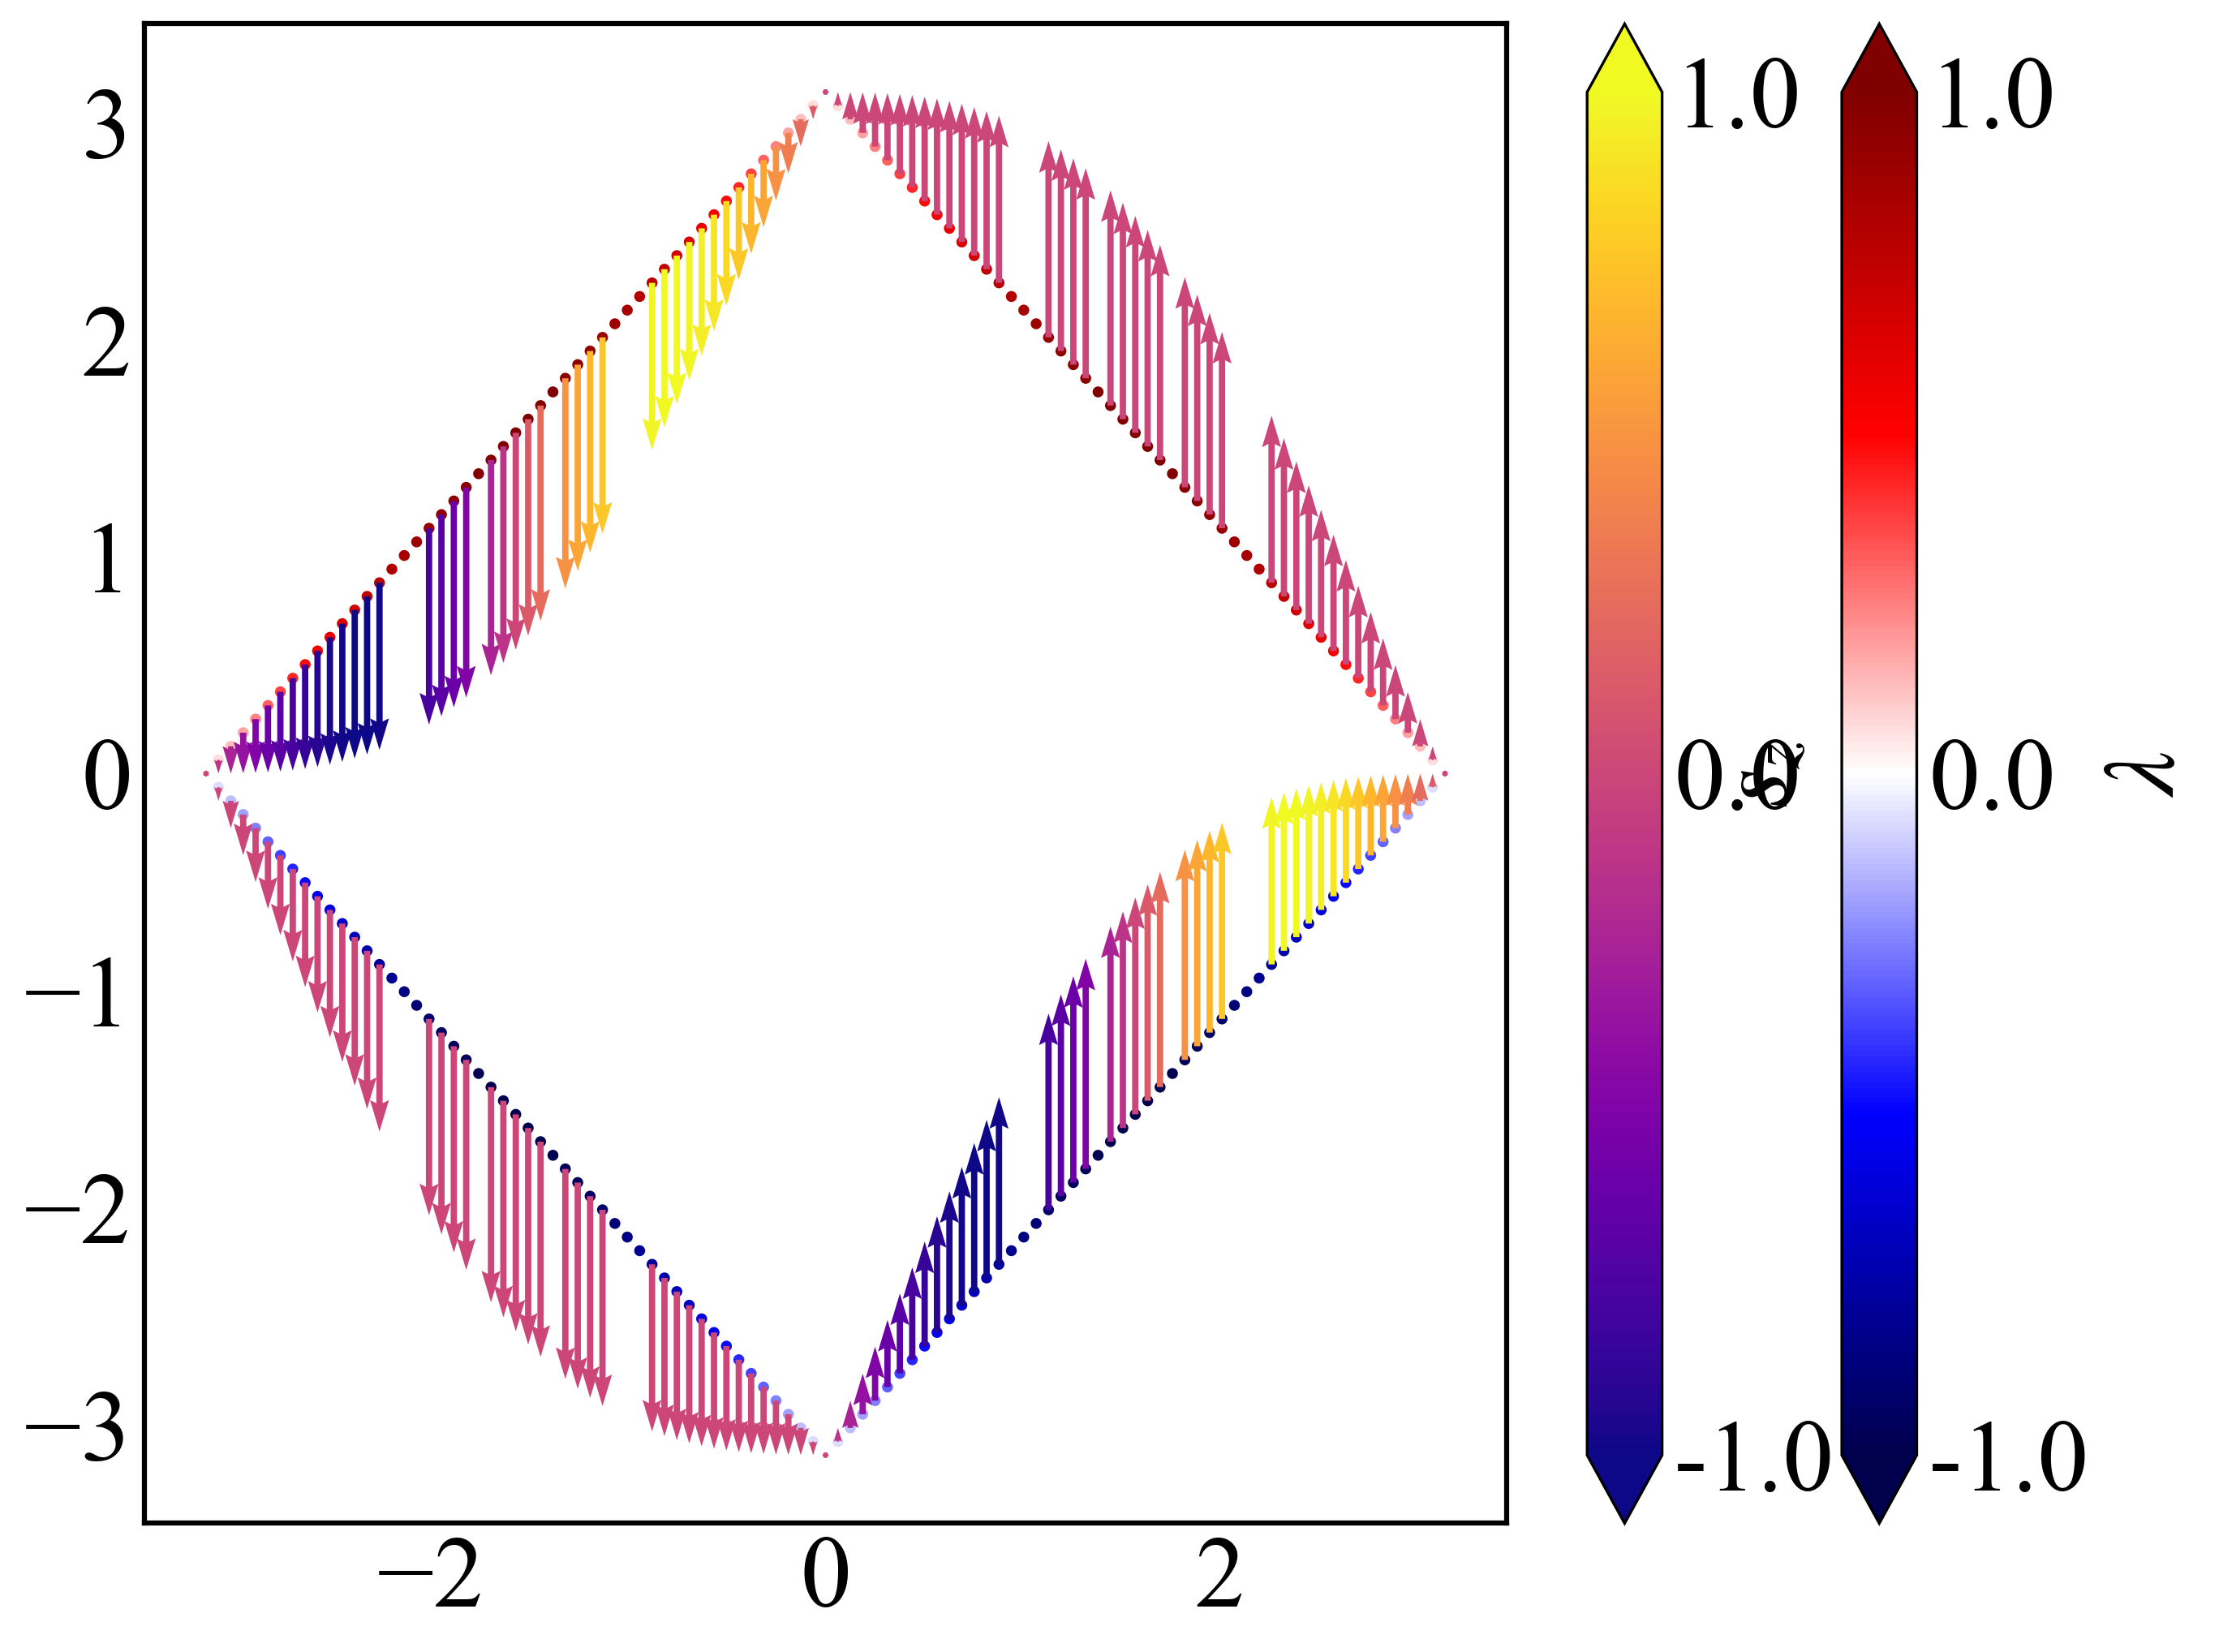
鉴于该网站分享的大都是学习笔记,作者水平有限,若发现有问题可以发邮件给我
- yxliphy@gmail.com
也非常欢迎喜欢分享的小伙伴投稿


欢迎关注公众号,有趣的内容也会在上面同步。 有密码的文章属于正在建设中或者没有通过验证的内容,若有需要可通过邮件联系。