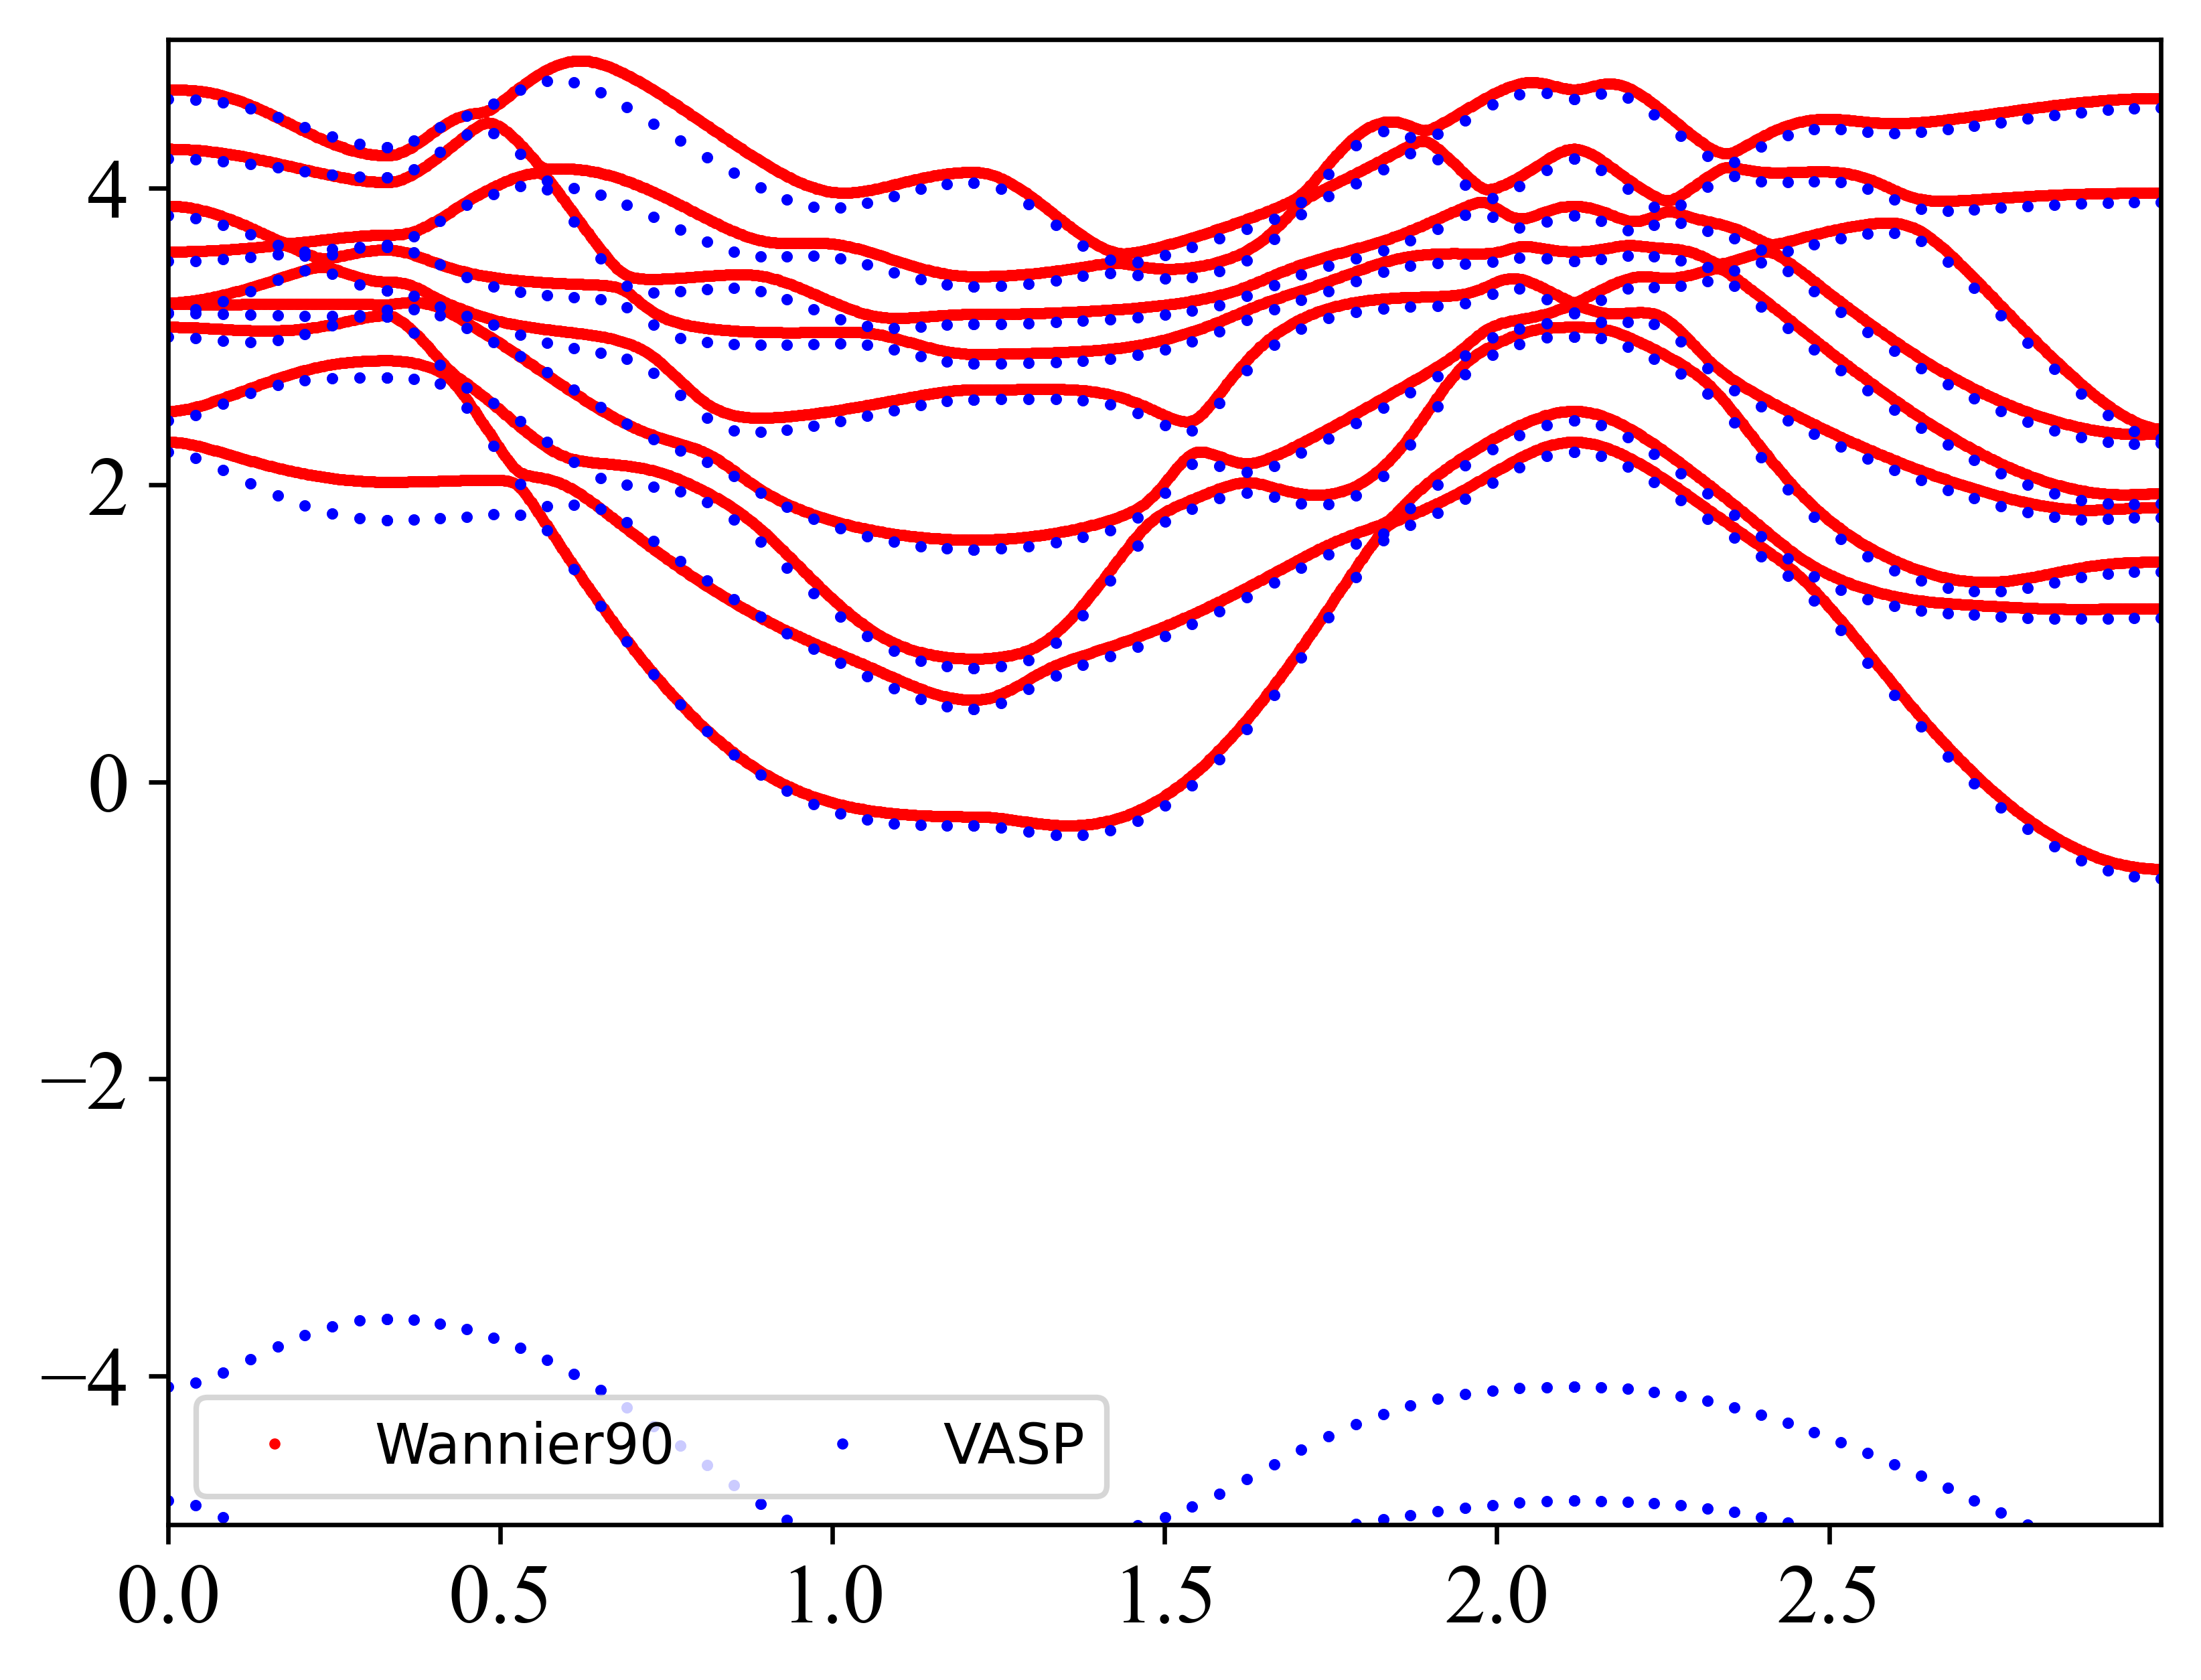
绘制VASP能带和Wannier插值能带进行比较
通常利用Wannier对VASP计算的能带进行拟合的时候,最终总是要看一下到底拟合程度有多好,这里就用Python写个脚本,将二者放在一起进行比较。
{:.info}
数据准备
首先VASP计算的能带结果可以通过vaspkit来获得,最终可以得到一个BAND.dat的数据,使用Wannier90最终也可以得到一个wannier90_band.dat的数据,
有了这两个文件之后,就可以进行能带绘制的,下面就是代码。
代码
1 | # 通过读取Wannier90给出的能带数据wannier90_band.dat,与VASP结合vaspkit得到的数据BAND.dat |
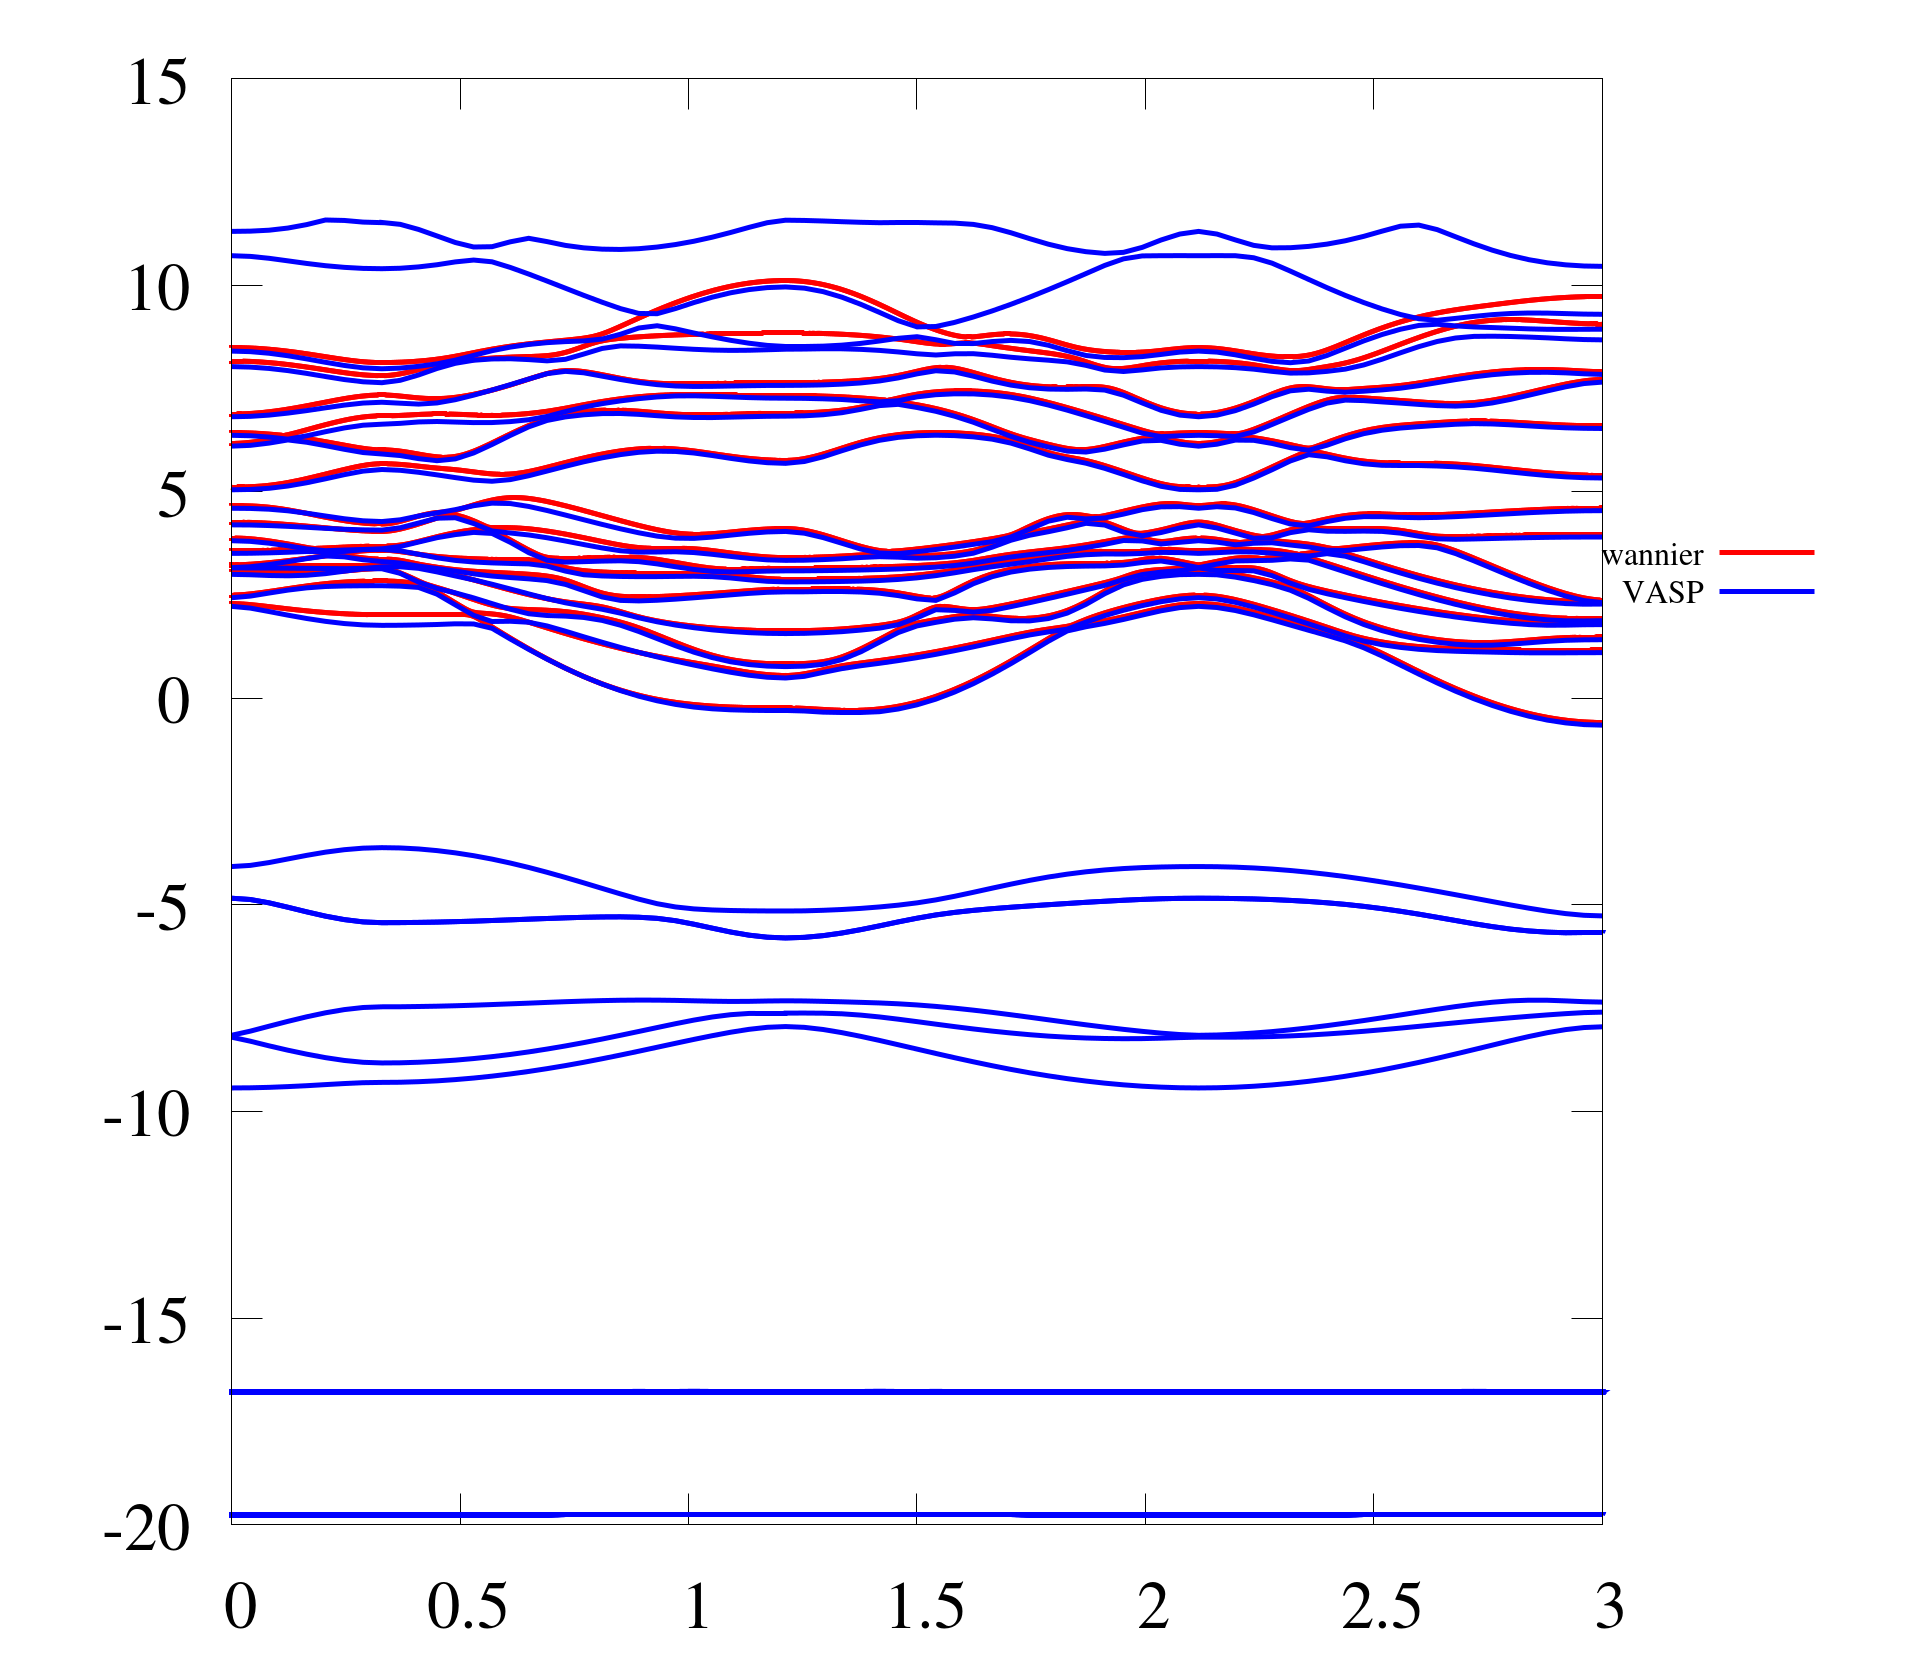
这里出了用python之外,还可以使用gnuplot来绘制结果
1 | set style data dots |
公众号
相关内容均会在公众号进行同步,若对该Blog感兴趣,欢迎关注微信公众号。
{:.info}

|
yxliphy@gmail.com |
本博客所有文章除特别声明外,均采用 CC BY-NC-SA 4.0 许可协议。转载请注明来源 Yu-Xuan's Blog!
 wechat
 alipay
相关推荐
2021-12-22
通过python读取EIGENVAL获取wannier90构造tb模型的冻窗口和解纠缠窗口
在通过Wannier90构建tb模型的时候,总是需要比较好的确定冻窗口和解纠缠窗口,而且这两个窗口的选取会很大的影响构造的tb的好坏,这里就想通过代码,先粗略的估计一下这两个能量窗口的范围,再通过进一步的细致调节来构造处比较好的tb模型。{:.info} 获取价带和导带在构造Wannier的时候,首先需要明确的就是想要构造那一部分能带的Wannier,通常就是费米面附近的能带,这对研究很多性质都是非常重要的。首先是通过fatband分析,看看在费米面附近主要是哪些原子的那些轨道产生了贡献,以Bi为例,原胞中含有两个Bi原子,通过fatbang分析发现费米面附近主要是由$s,p_x,p_y,p_z$轨道贡献,而且体系是考虑SOC的,所有在构建Wannier的时候需要考虑的能带的数目就是 2*(1+1+1+1)*2 = 16这里的第一个2表示原胞中的两个Bi原子,四个1则是代表4条轨道,最后的2是因为考虑的SOC,所以还是需要考虑每条轨道的自旋自由度。 在确定了要构建的Wannier能带的数目之后,下面的一步就是要确定费米面的位置,这个值通过是可以在VASP计算的OUTCAR中得到的1cat OUTCAR |grep E-fermi|awk 'BEGIN {FS=" "} {print $3}' # 从OUTCAR中提取自洽计算的费米能在得到了费米能之后,就可以进一步通过EIGENVAL中的结果来确定每个k点上的能量,将所有的k点连接起来就是一条能带,可以获取每条能带的带顶和带底,通过与费米能量的比较就可以知道哪些带是占据能带(价带),哪些带是空带(导带)。123456789101112131415161718192021222324252627282930313233343536373839404142434445464748import numpy as npimport matplotlib.pyplot as pltimport osdef valread(): """通过读取EIGENVAL文件来获取每条能带的最大值和最小值""" os.chdir(os.getcwd()) #...
2020-07-01
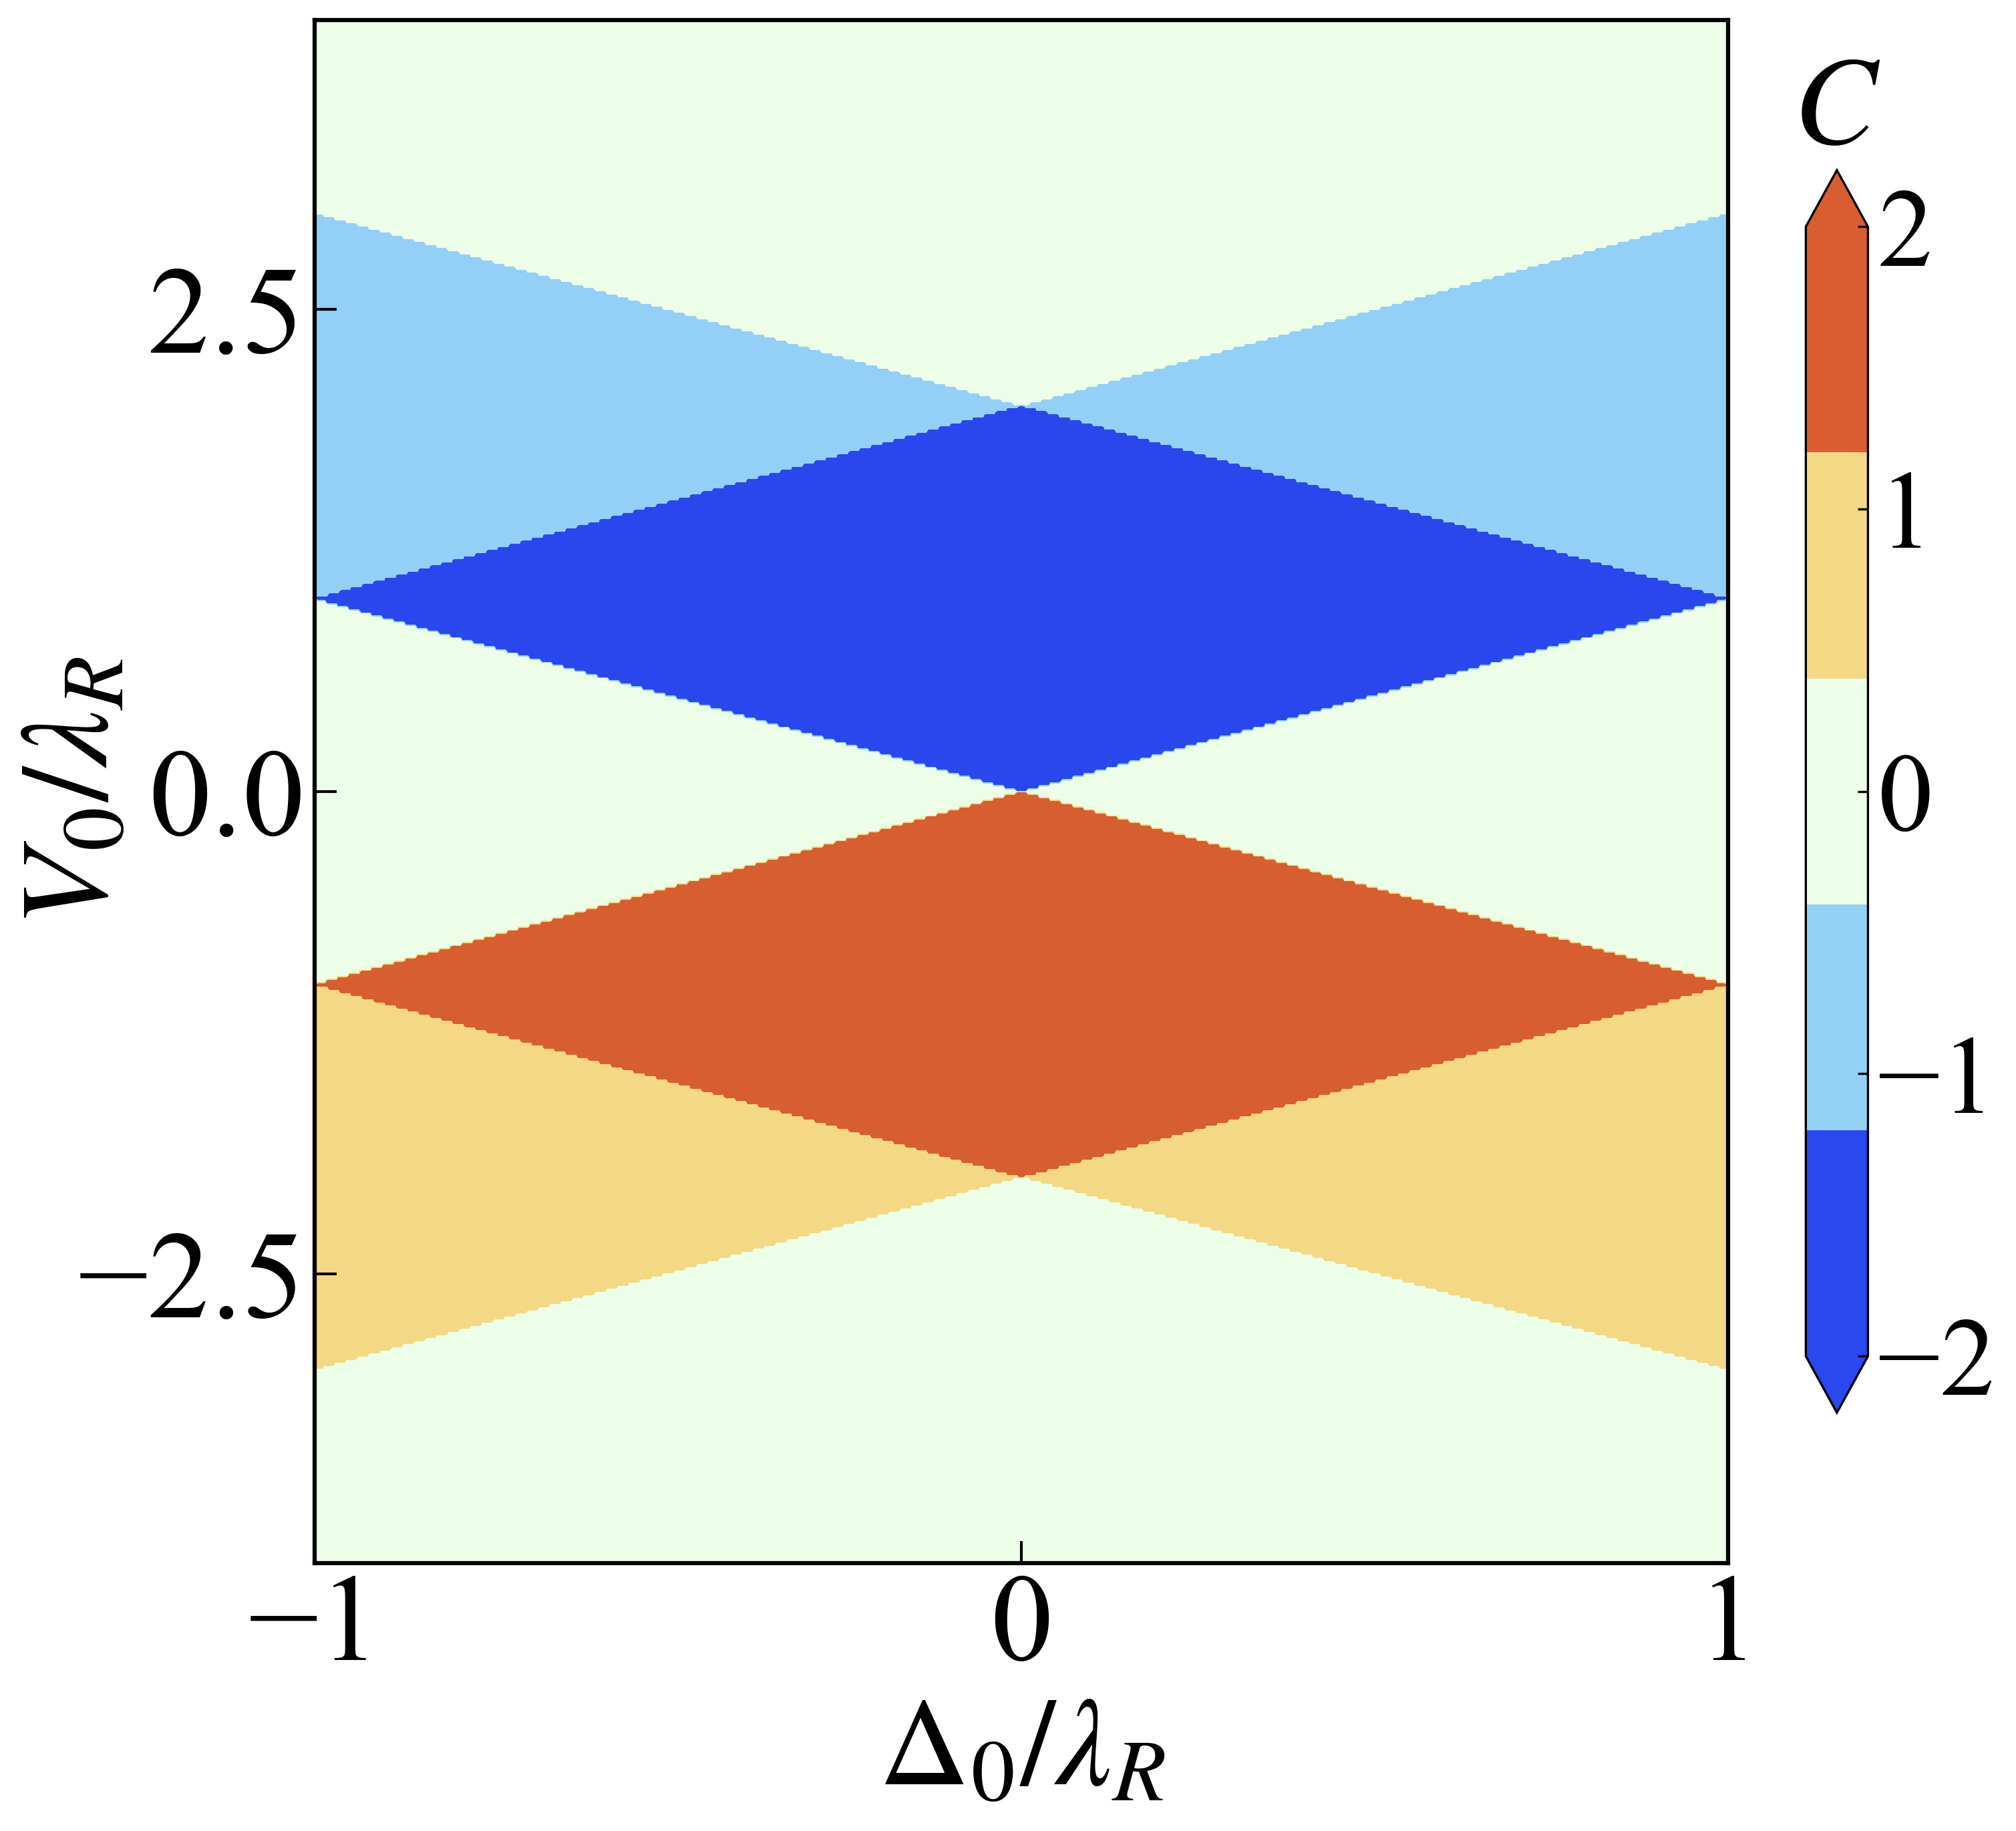
两种方法计算Chern Number
计算Chern数是最初学习拓扑物理都会遇到的问题,正好在假期空闲的时候自己学习了一下Chern数的数值计算方法,在博客上记录一下希望可以帮助到别人。{:.info}具体的计算方法和细节就不在这里说明了,只要是想学习计算Chern数的肯定了解它在凝聚态物理中的角色,而计算的细节也会在后面的参考文献中给出,只是展示一下结果。 Julia语言计算Chern numberVersion1这个方法是直接用定义直接计算的结果,但是可能会遇到波函数规范选择的问题,会导致结果有误,而具体的规范问题,我并不懂,所以一般我会选择第二种方法来计算,也就是后面参考文献中介绍的方法。1234567891011121314151617181920212223242526272829303132333435363738394041424344454647484950515253545556575859606162636465666768697071727374import PkgPkg.add("LinearAlgebra")Pkg.add("PyPlot")using LinearAlgebra,PyPlotfunction matSet(kx::Float64,ky::Float64)::Matrix{ComplexF64} m0::Float64 = -1.0 t1::Float64 = 1.0 t2::Float64 = 1.0 t3::Float64 = 0.5 # 这里选取的是量子反常Hall效应的模型 ham = zeros(ComplexF64,2,2) ham[1,1] = m0 + 2*t3*sin(kx) + 2*t3*sin(ky) + 2*t2*cos(kx + ky) ham[2,2] = -(m0 + 2*t3*sin(kx) + 2*t3*sin(ky) + 2*t2*cos(kx + ky)) ham[1,2] = 2*t1*cos(kx) - 1im*2*t1*cos(ky) ham[2,1] = conj(ham[1,2]) return...
2021-04-18
$Bi_2Se_3$第一性计算结果重复
学习第一性计算也有一段时间了,这里利用VASP+Wannier90+WannierTools来完整复现一下$Bi_2Se_3$这个材料的一些拓扑性质.{:.info}先整理下大致的流程,首先通过VASP自洽计算,得到收敛结果. 第二步结合Wannier90得到Tight binding模型的数据信息. 第三步就是在第二步的基础上得到利用wannier90_hr.dat来计算拓扑相关的性质. VASPVASP的计算中需要分两步进行, 首先不考虑SOC进行一次电子自洽, 这里我是直接使用WannierTools文档中$Bi_2Se_3$的晶体结构来计算的, 所以并没有进行结构优化方面的计算. No-SOCVASP计算需要的文件内容如下 INCAR 123456789101112131415161718192021222324252627282930313233343536SYSTEM = NaClICHARG = 2ISTART = 0ISYM = 0ISPIN = 2 # 这里需要考虑自旋, 但是此时并没有打开自旋轨道耦合GGA = PE# MAGMOM = 6*0 2*4 2*0PREC = NormalENCUT = 500ALGO = FASTEDIFF = 1E-4EDIFFG = -0.02LREAL = AutoISIF =0IVDW = 11NELM = 500NELMIN = 5NSW = 0IBRION = -1ISMEAR = 0SIGMA = 0.05NWRITE = 2LWAVE = .T.LCHARG = .T.LORBIT = 11##SOC### LSORBIT = .TRUE.# SAXIS = 0 0 1# NBANDS = 128# LMAXMIX = 4# GGA_COMPAT = .FALSE POSCAR 12345678910111213Bi2Se31.0-2.069 -3.583614 0.000000 2.069 -3.583614 0.000000 0.000 2.389075 9.546667Bi Se 2 3Direct 0.3990 0.3990 0.6970 0.6010 0.6010 ...
评论