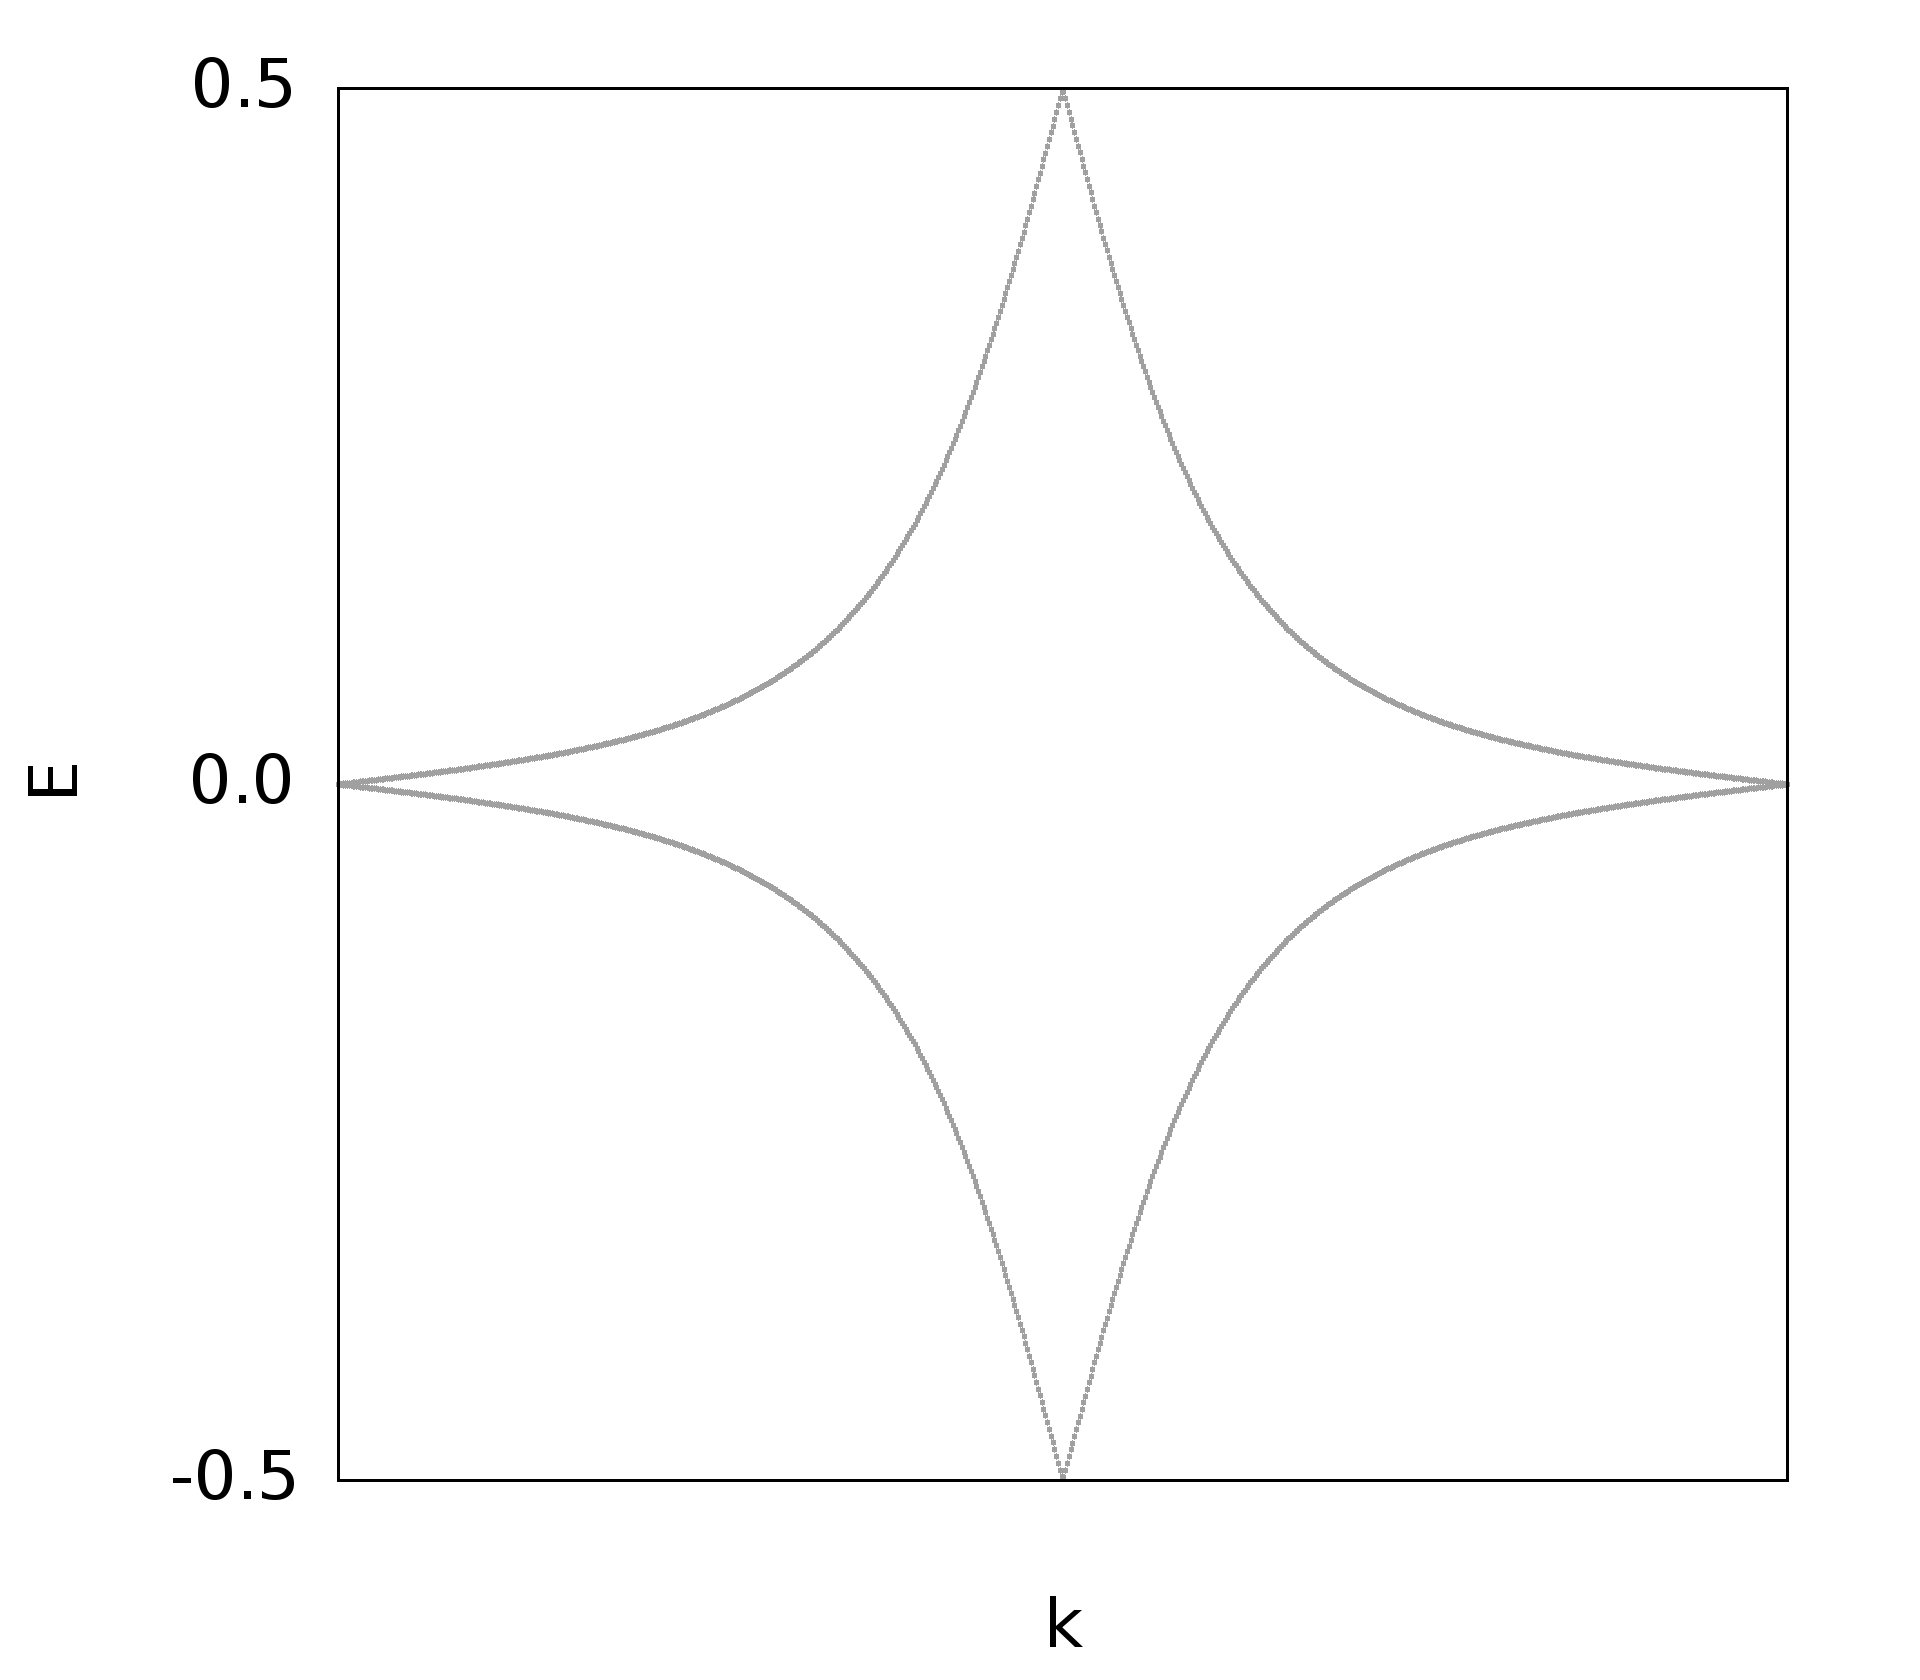
这里整理一下计算BHZ模型Wilson loop的代码.
BHZ模型是最初学习拓扑时接触比较早的模型,前面也整理过如何计算BHZ模型的$\mathcal{Z}_2$拓扑不变量,但是其拓扑性质仍然可以通过Wilson loop来进行计算,所以这里就利用Julia来计算一下这个模型的Wilson loop.
代码
using LinearAlgebra,PyPlot,DelimitedFiles
# =====================================================
function Pauli()
    hn::Int64 = 4
    g1 = zeros(ComplexF64,hn,hn)
    g2 = zeros(ComplexF64,hn,hn)
    g3 = zeros(ComplexF64,hn,hn)
    #----------------
    g1[1,1] = 1
    g1[2,2] = -1
    g1[3,3] = 1
    g1[4,4] = -1
    #-------------
    g2[1,2] = 1
    g2[2,1] = 1
    g2[3,4] = -1
    g2[4,3] = -1
    #-------------
    g3[1,2] = -im
    g3[2,1] = im
    g3[3,4] = -im
    g3[4,3] = im
    return g1,g2,g3
end
# =====================================================
function BHZ(kx::Float64,ky::Float64)::Matrix{ComplexF64}
    # 构造系统哈密顿量
    hn::Int64 = 4
    m0::Float64 = 1.5
    tx::Float64 = 1.0
    ty::Float64 = 1.0
    lamx::Float64 = 1.0
    lamy::Float64 = 1.0
    g1 = zeros(ComplexF64,hn,hn)
    g2 = zeros(ComplexF64,hn,hn)
    g3 = zeros(ComplexF64,hn,hn)
    ham = zeros(ComplexF64,hn,hn)
    g1,g2,g3 = Pauli()
    for i1 = 1:hn
        for i2 = 1:hn
            ham[i1,i2] = (m0 - tx*cos(kx) - ty*cos(ky))*g1[i1,i2] + lamx*sin(kx)*g2[i1,i2] + lamy*sin(ky)*g3[i1,i2]
        end
    end
    return ham
end
# ======================================================================
function main()
    nx::Int64 = 100
    ny::Int64 = 800
    Noccu::Int64 = 2  # 占据态数目
    Kx = range(0.0,2,length = nx)
    Ky = range(0.01,2,length = ny)
    klist = []
    Wave = zeros(ComplexF64,4,4,nx)
    Wan = zeros(ComplexF64,Noccu,Noccu)
    ang = zeros(Float64,ny,Noccu)
    f1 = open("test.dat","w")
    for iy in 1:ny
        ky = Ky[iy]*pi
        append!(klist,ky)
        for ix in 1:nx    # 在固定ky的时候,对每一个kx进行对角化
            kx = Kx[ix]*pi
            ham = BHZ(kx,ky)
            val,vec = eigen(ham)
            Wave[:,:,ix] = vec[:,:]  # 存储所有点上的本征矢量
        end
        Wave[:,:,nx] = Wave[:,:,1]  # 首尾相连
        F = 1
        for i1 in 1:nx-1
            for i2 in 1:Noccu
                for i3 in 1:Noccu
                    Wan[i2,i3] = Wave[:,i2,i1]'*Wave[:,i3,i1 + 1]   # 计算Berry联络
                end
            end
            F = F*Wan
        end
        val,vec = eigen(F)
        ang[iy,:] = map(angle,val)/(2*pi)
        writedlm(f1,[ky/pi ang[iy,1] ang[iy,2]])
    end
    plot(klist,ang)
    close(f1)
    savefig("a.png",bbox_inches="tight",dpi=300)  # 保存作图文件
    return klist,ang
end
# =================================================================
@time main()
- 计算结束后,利用
fortran`来将数据进行格式化program main implicit none integer m1,m2,m3 call main1() stop end program !======================================================= subroutine main1() ! 读取不明行数的文件 implicit none integer count,stat real h1,h2,h3,h4,h5,h22 h1 = 0 h2 = 0 h3 = 0 h22 = 0 open(1,file = "test.dat") open(2,file = "test-format.dat") count = 0 do while (.true.) count = count + 1 h22 = h1 ! read(1,*,iostat = STAT)h1,h2,h3,h4,h5 read(1,*,iostat = STAT)h1,h2,h3 ! if(h22.ne.h1)write(2,*)"" ! 在这里加空行是为了gnuplot绘制密度图 ! write(2,999)h1,h2,h3,h4,h5 ! 数据格式化 write(2,999)h1,h2,h3 ! 数据格式化 if(stat .ne. 0) exit ! 当这个参数不为零的时候,证明读取到文件结尾 end do ! write(*,*)h1,h2,h3 ! write(*,*)count close(1) close(2) 999 format(5f11.6) return end subroutine main1
绘图
set encoding iso_8859_1
#set terminal  postscript enhanced color font ",30"  # Set for eps formation
#set output 'wcc.eps'
set terminal png truecolor enhanced font ",50" size 1920, 1680 # Set for png formation
set output 'eigval.png'
unset key
set border lw 3
set xtics offset 0, 0.0
set xtics format "%4.1f" nomirror out
#set xlabel '{/symbol eta}'
set xlabel 'k'
set xlabel offset 0, -1.0
set ytics 0.5
unset xtics
#set ytics format "%4.1f" nomirror out
set ytics format "%4.1f"
set ylabel "E"
set ylabel offset 0.5, 0.0
#set xrange [3550: 4550]
#set yrange [-1.5:1.5]
plot for [i=2:3] 'test-format.dat' u 1:i w p  pt 7  ps 1.1 lc 'red' # 绘制多条线
#plot 'test-format.dat' u 1:2 w p pt 7 ps 4 lc 'red'

参考
公众号
相关内容均会在公众号进行同步,若对该Blog感兴趣,欢迎关注微信公众号。

|
yxli406@gmail.com |