超导序参量自洽(自由能极小值方法)
公式推导
起手先是一个有吸引相互作用的哈密顿量
平均场处理之后分解到超导通道,则可以得到BdG哈密顿量,不熟悉可以参考正常态到BdG哈密顿量的构建这篇笔记,或者参考李正中固体理论。超导序参量则需要自洽
体系的自由能为
这里的$E_n(\mathbf{k})$就是BdG哈密顿量的本征值,BdG哈密顿量为
通过给定不同的$\Delta$来对角化$H_{\rm BdG}(\mathbf{k})$得到本征值,从而可以计算自由能,而最小的自由能对应的$\Delta$就是自洽得到的超导序参量,所以这里实际上是通过一种遍历的方式来得到超导序参量的。
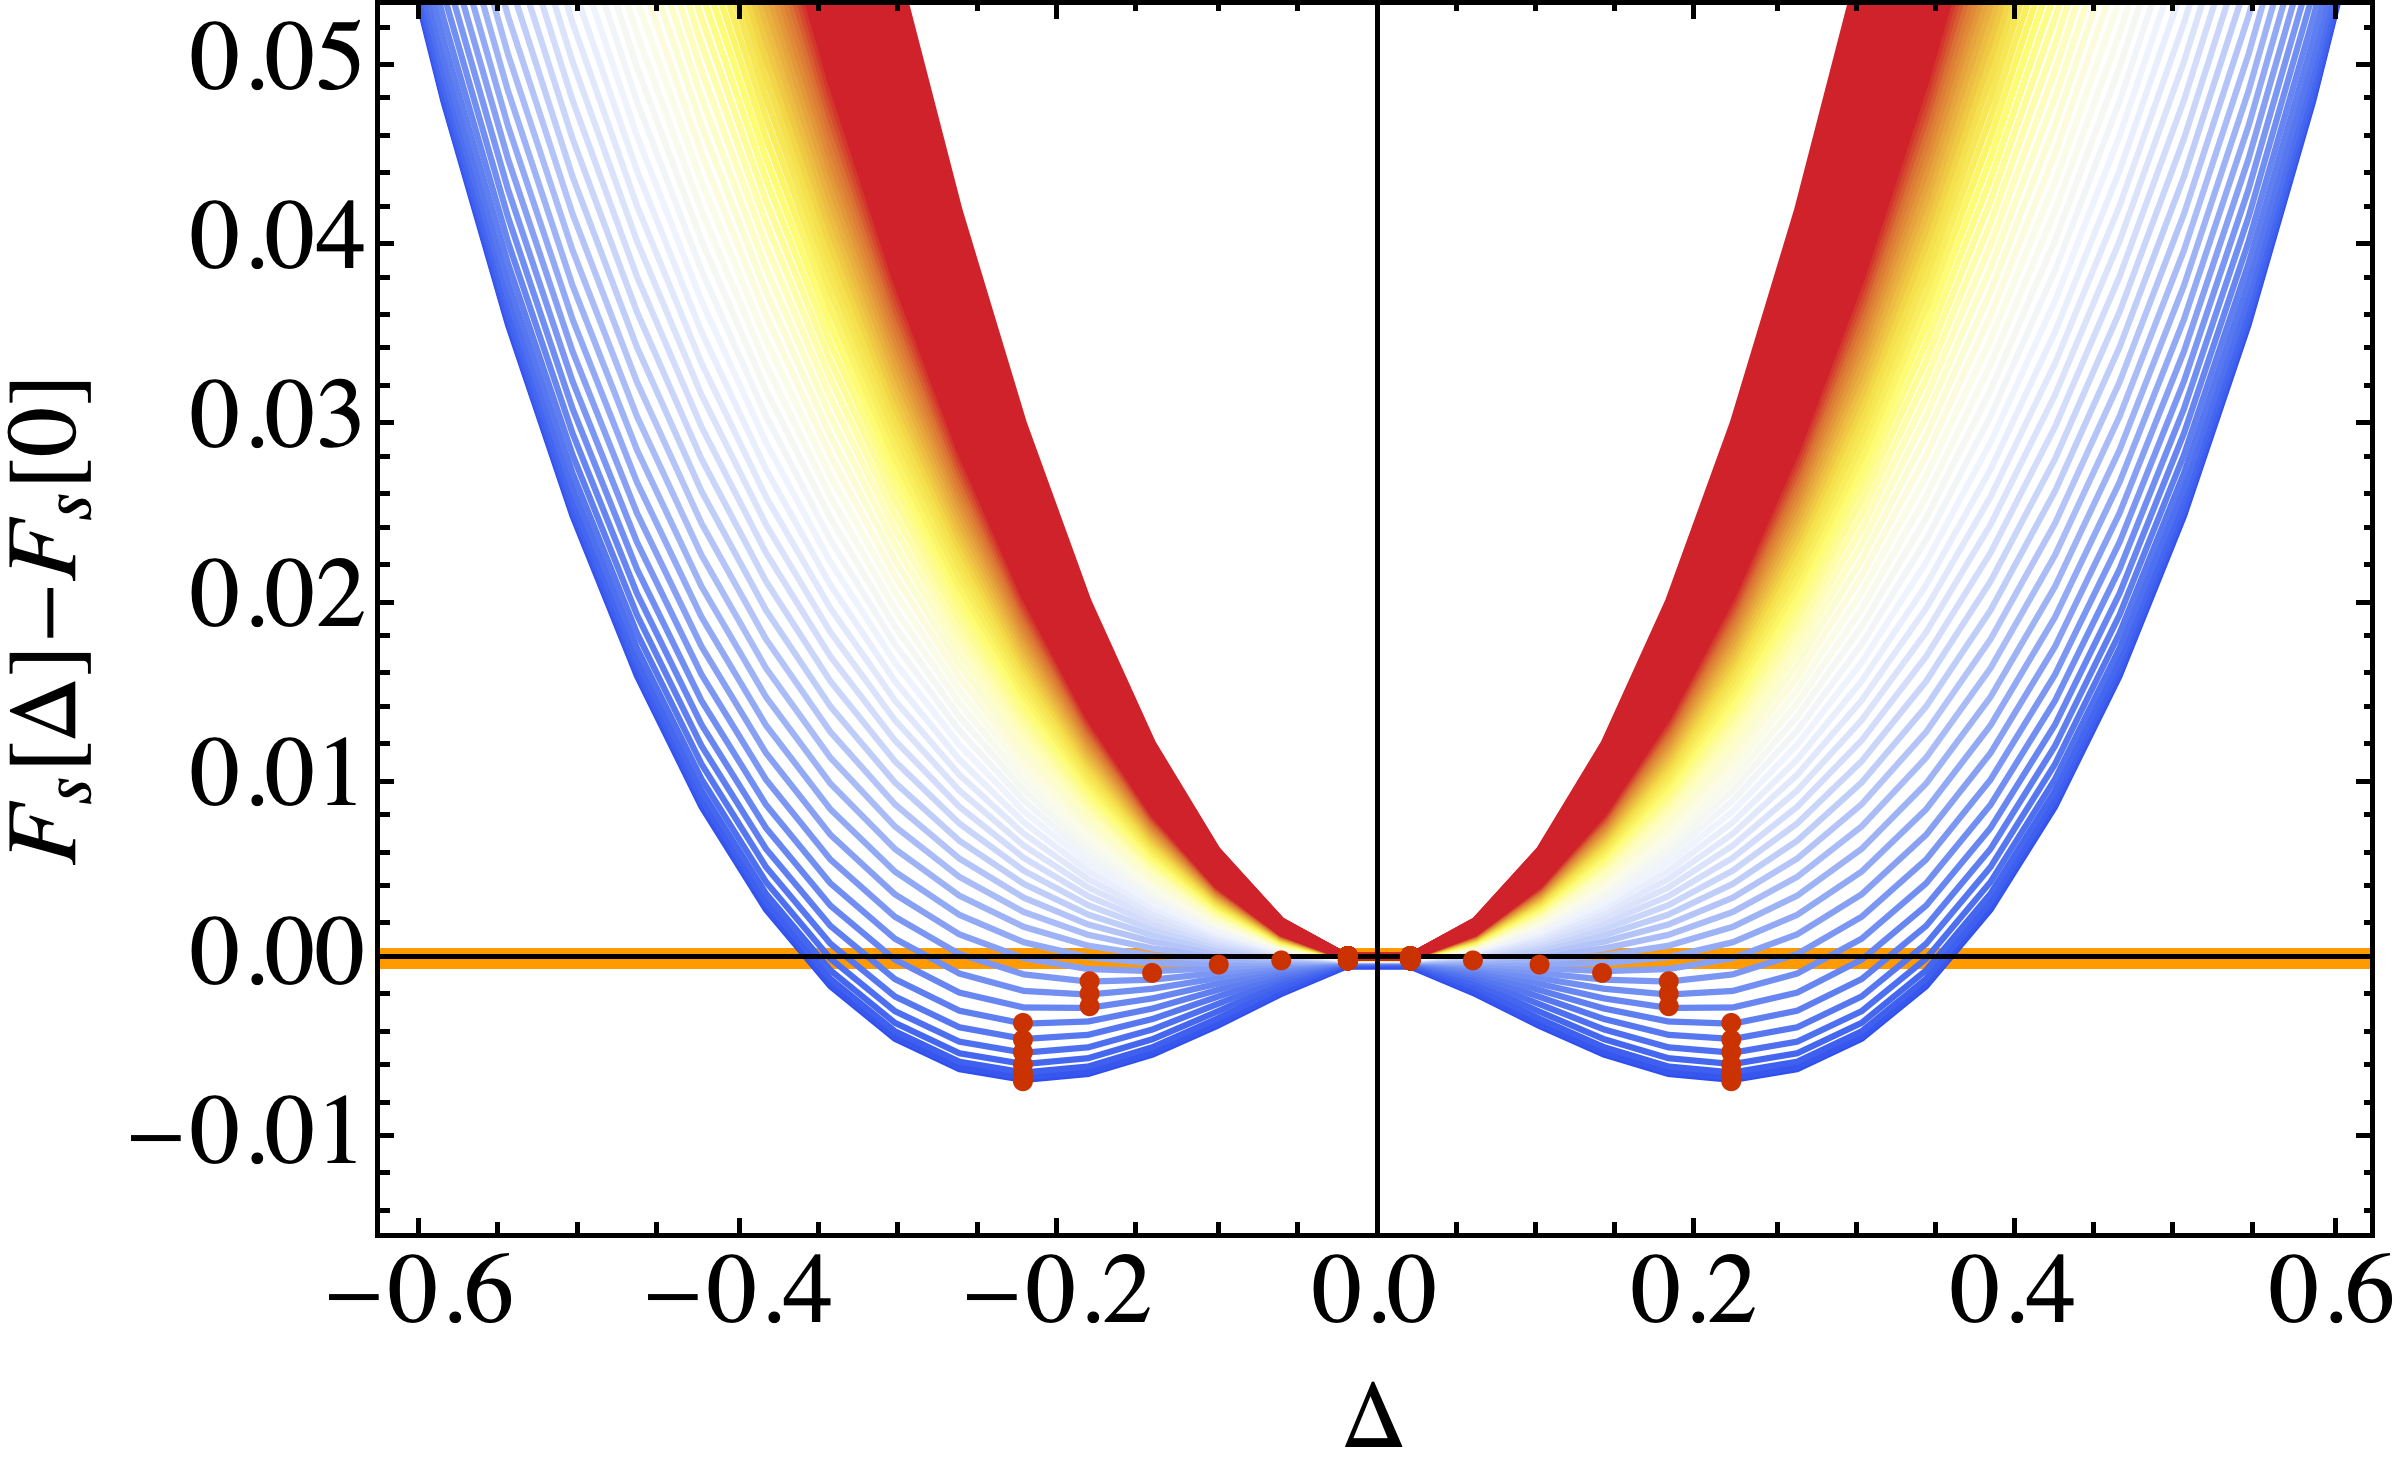
结果展示
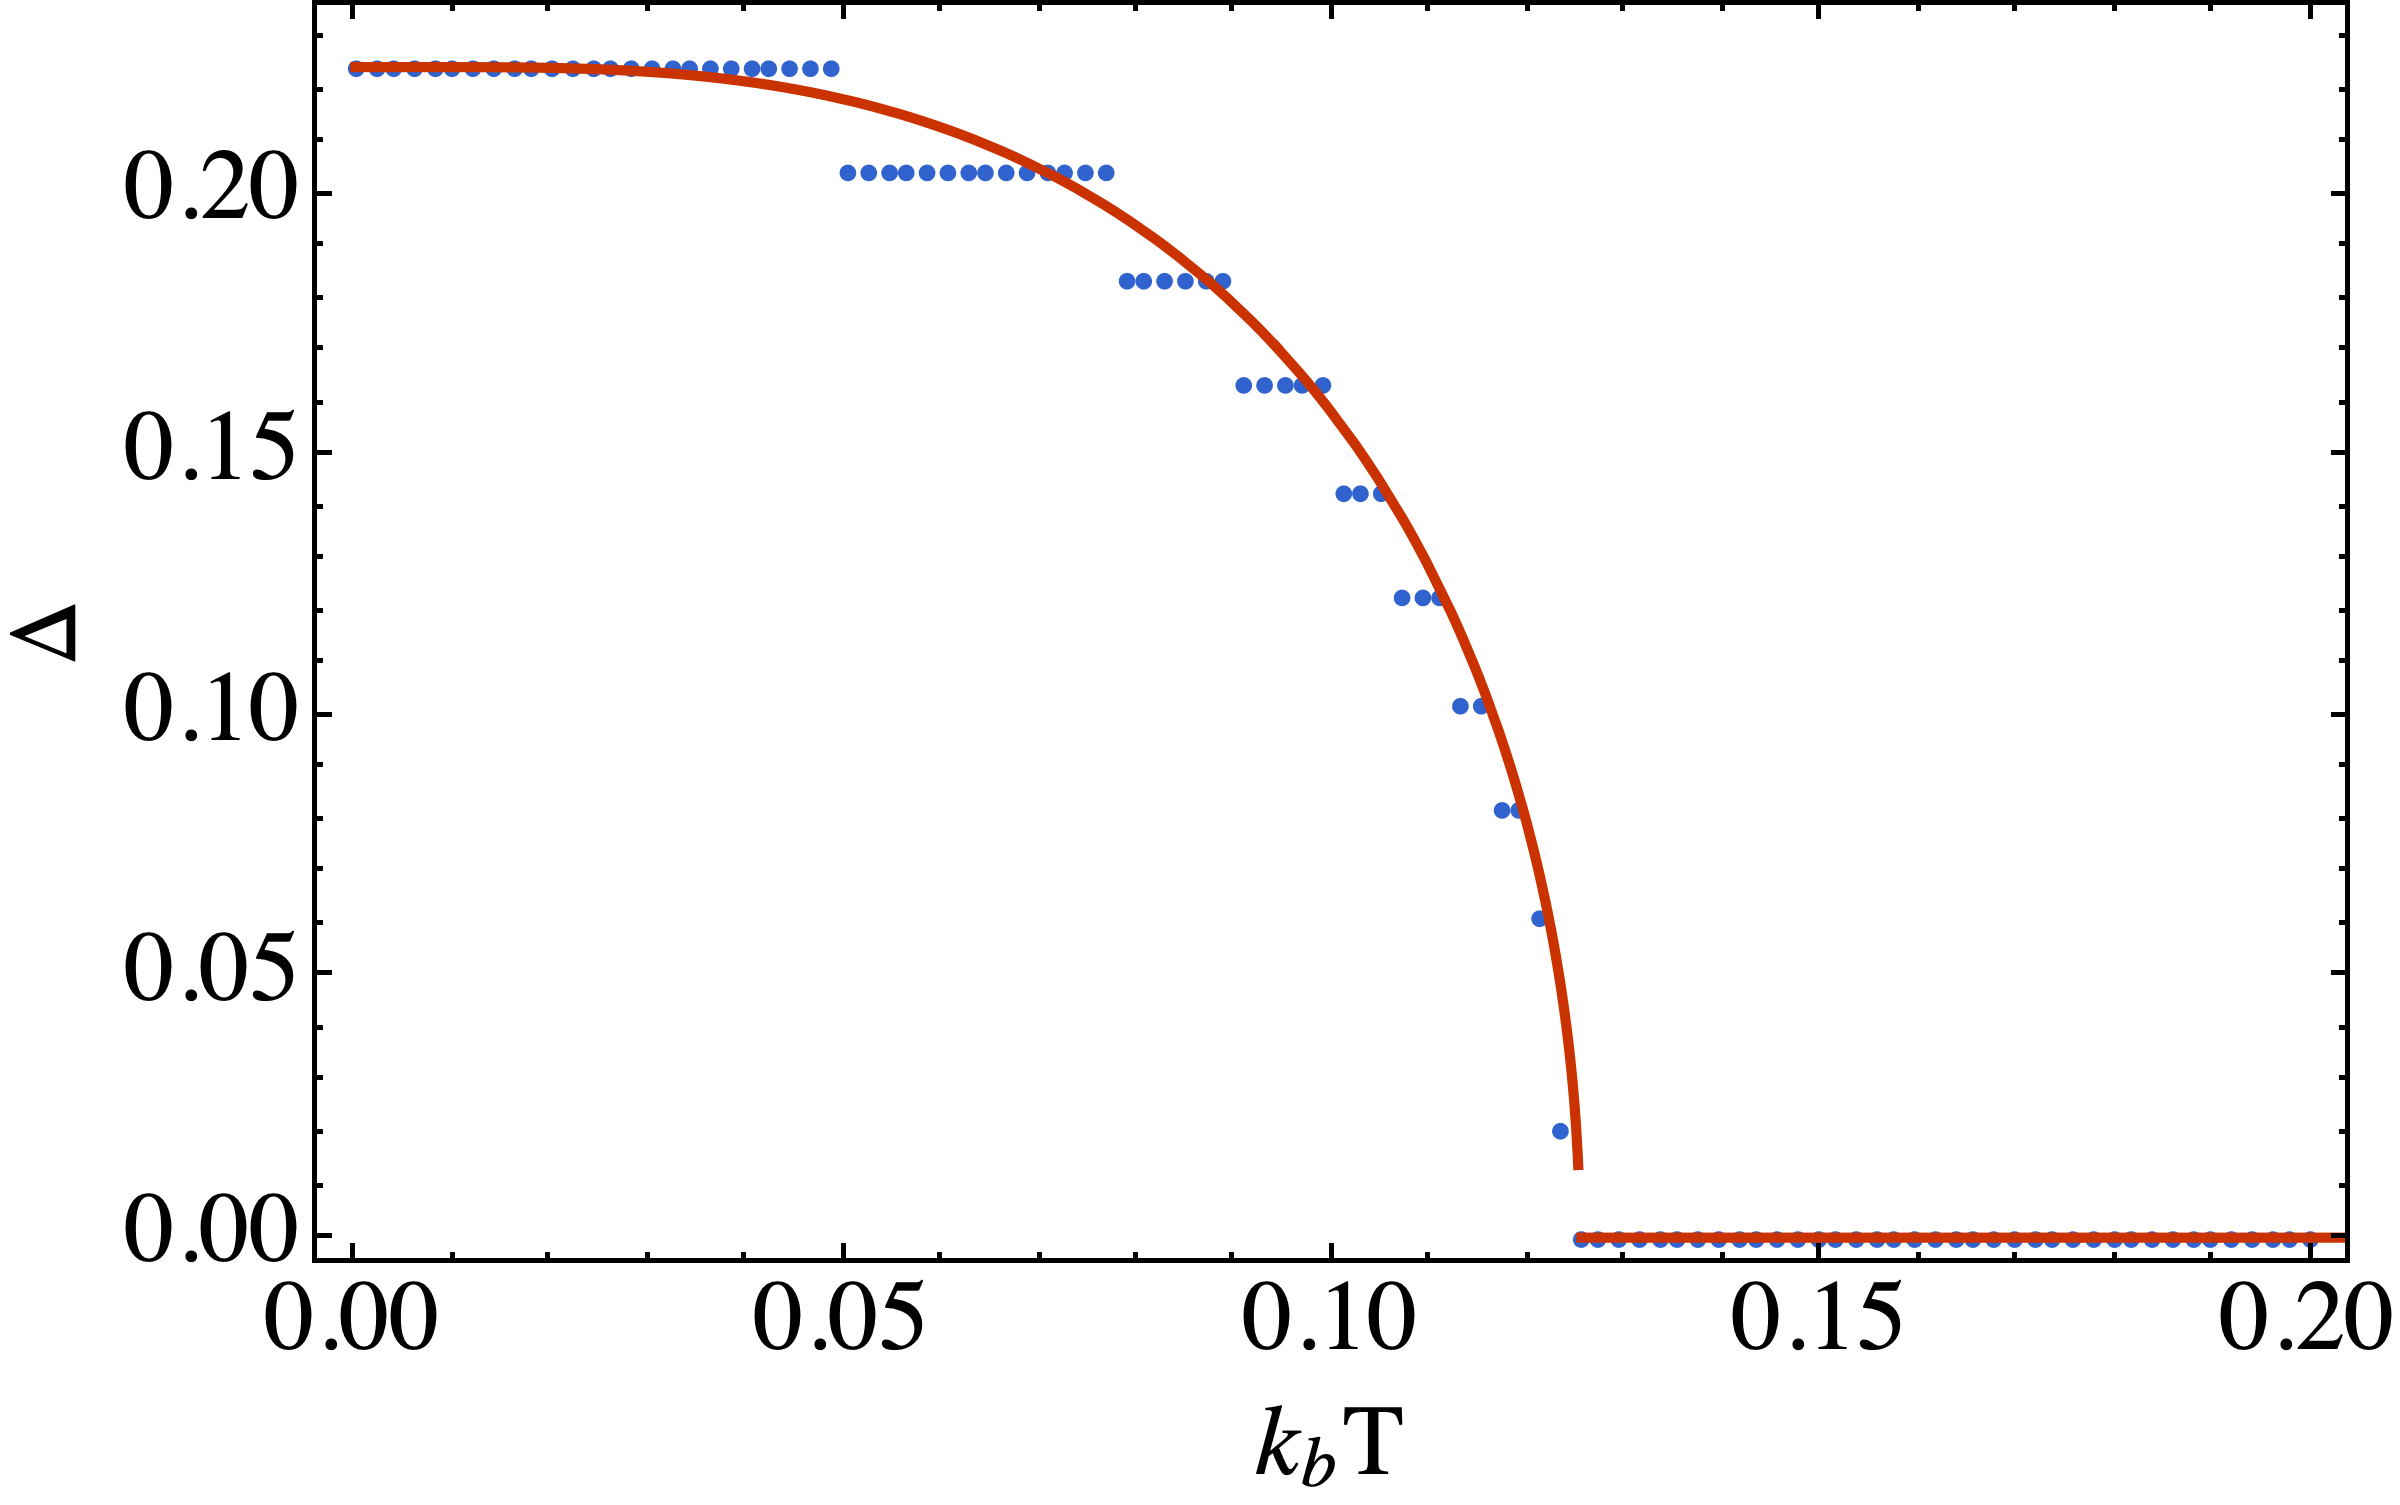
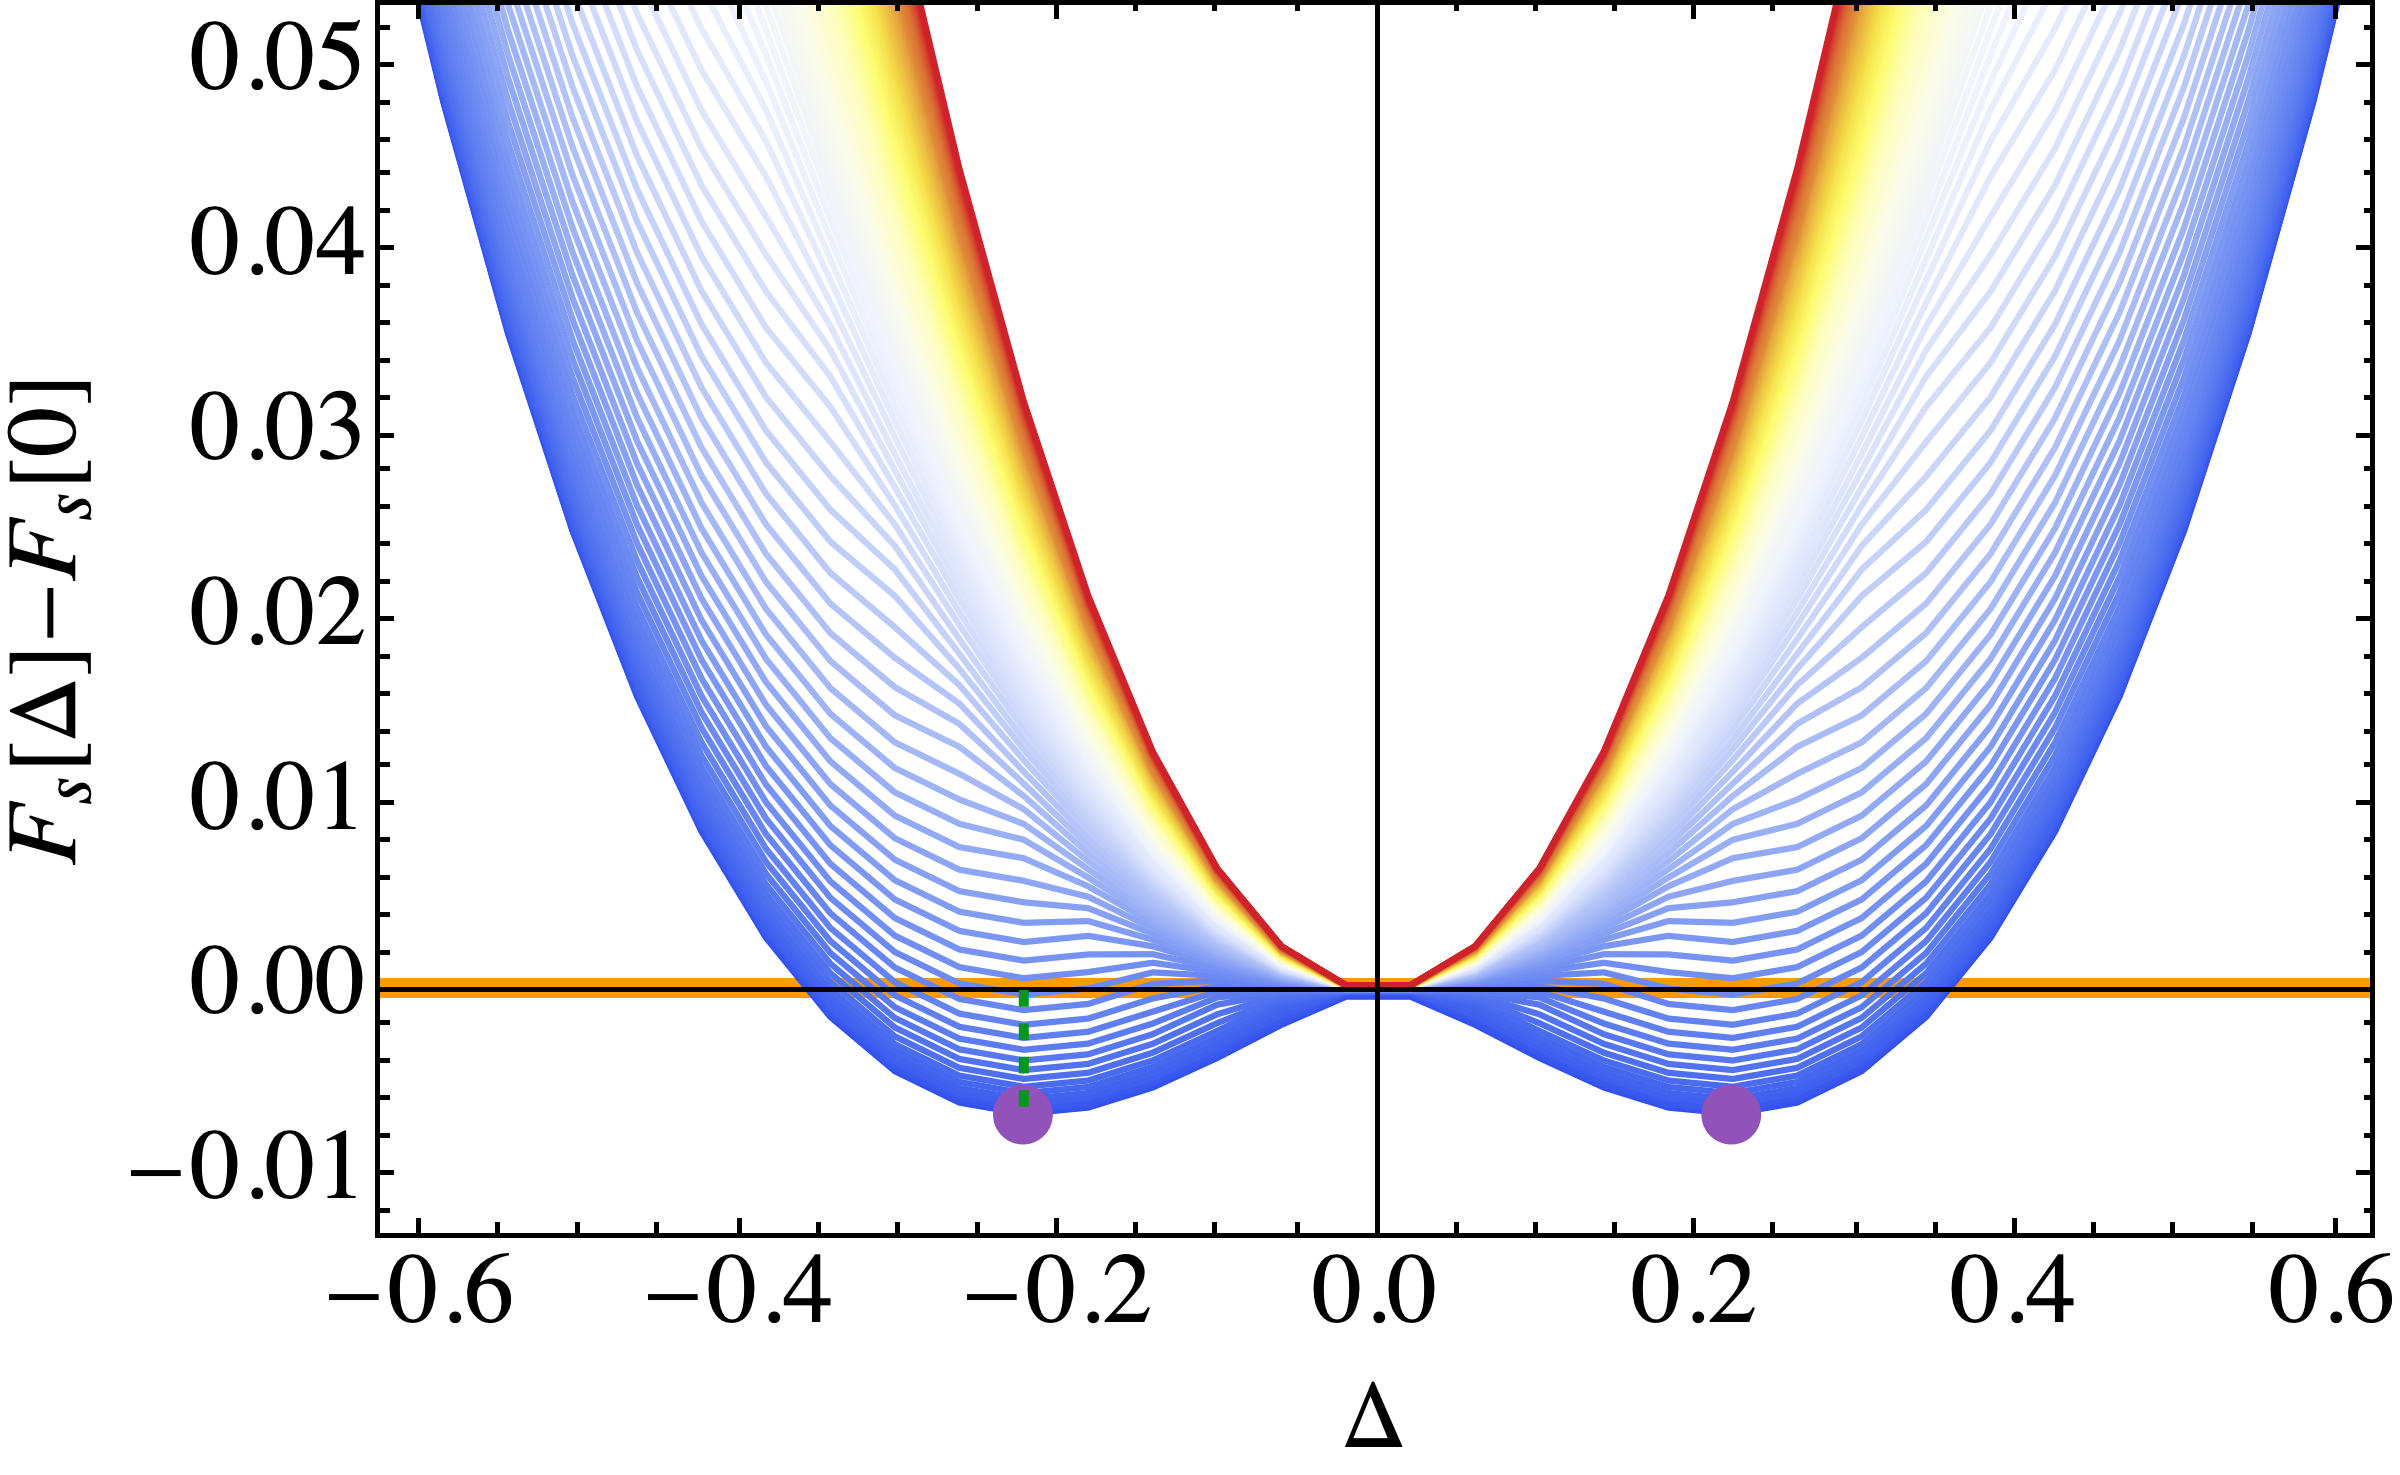
改变温度,自由能随序参量变化
最大序参量随温度的变化
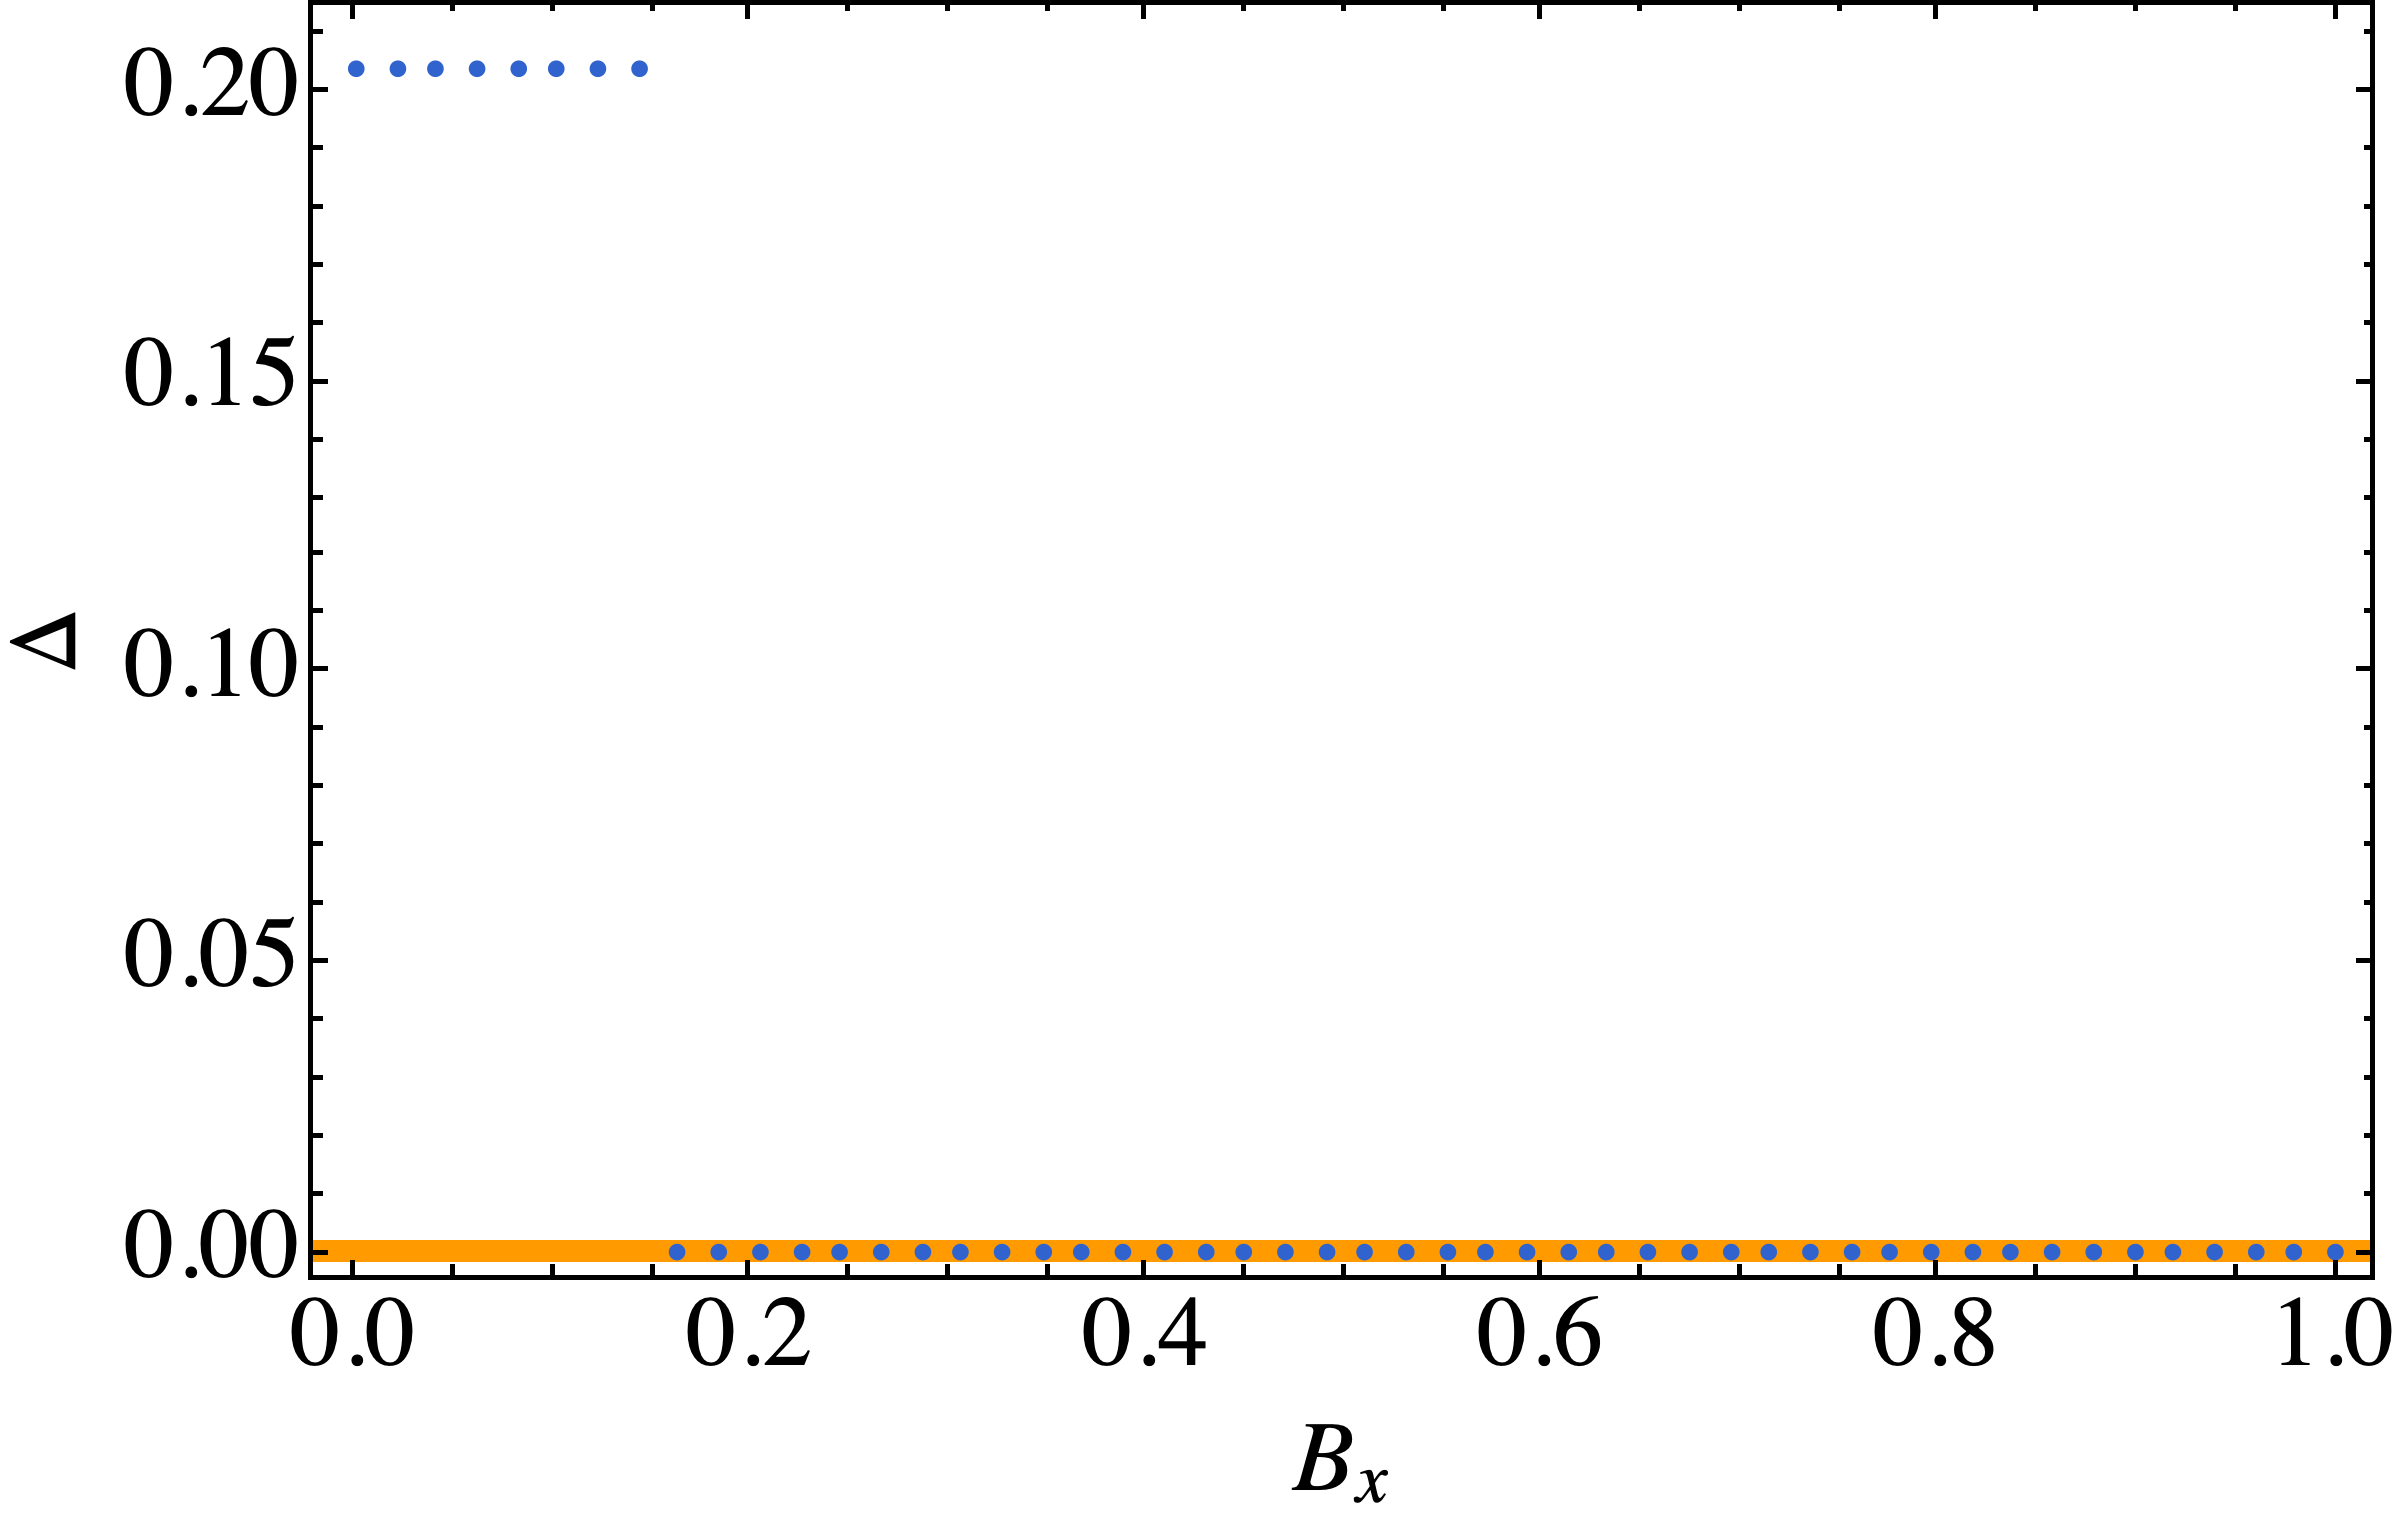
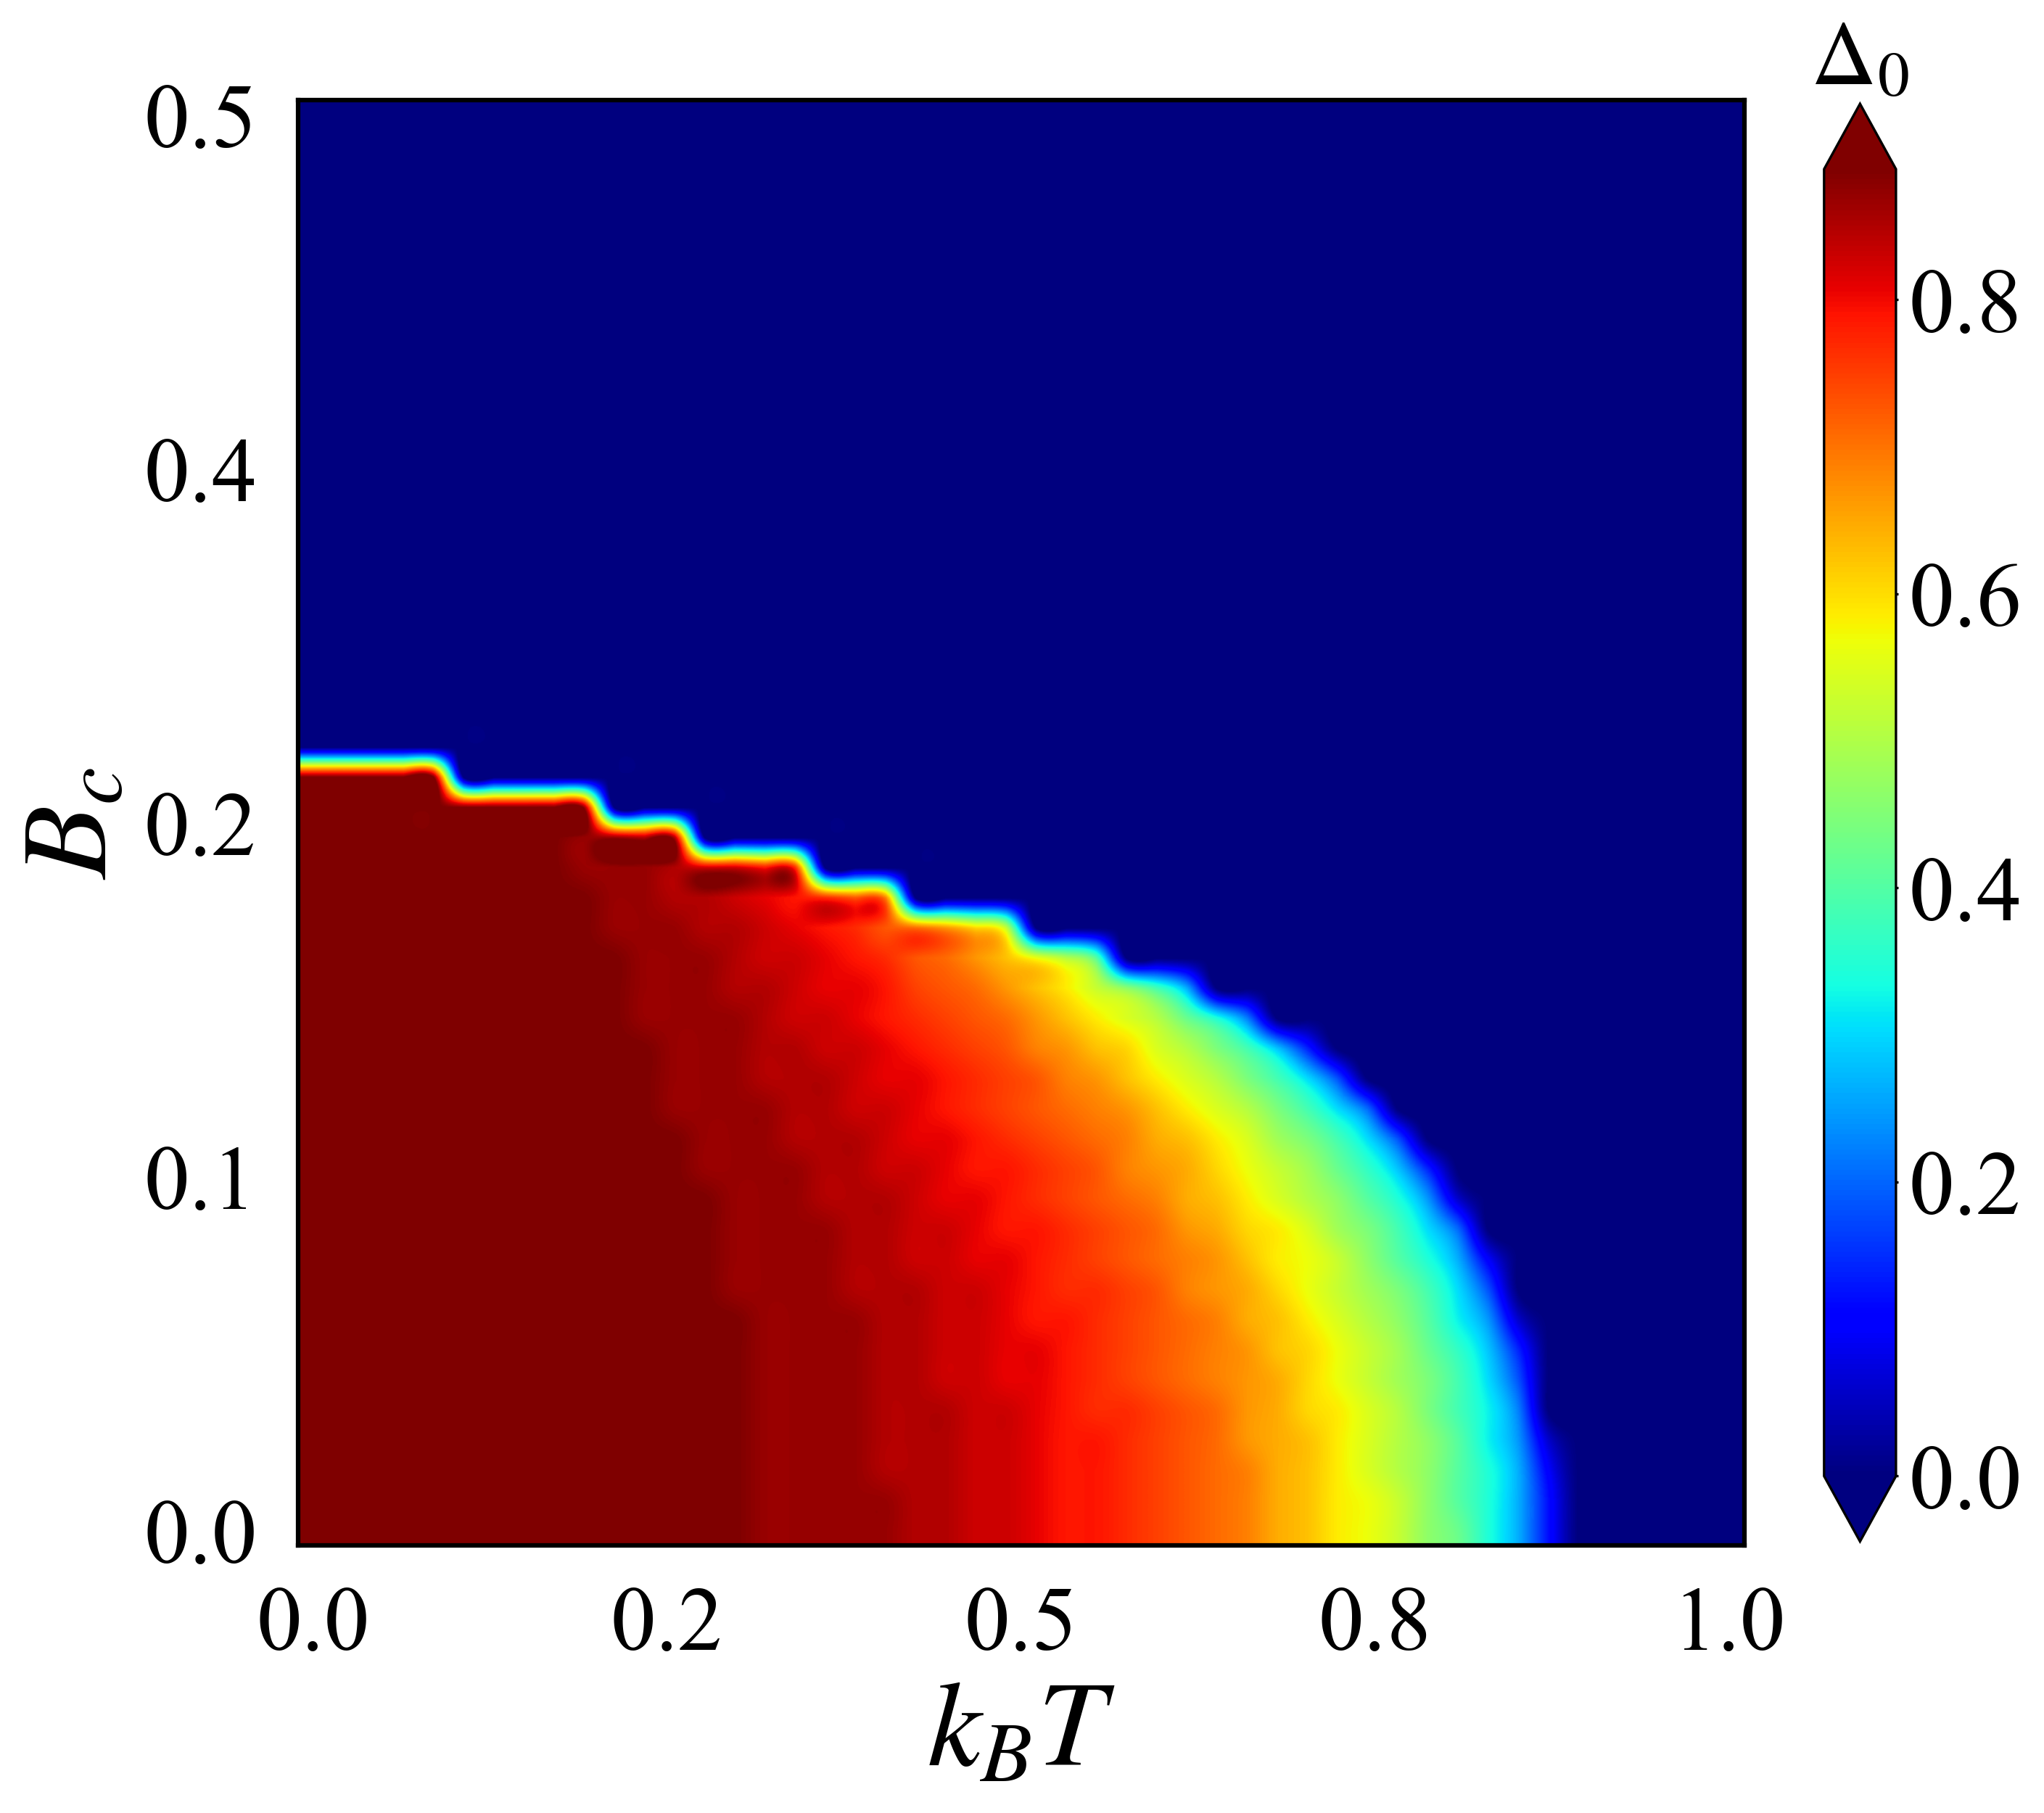
序参量随磁场的变化
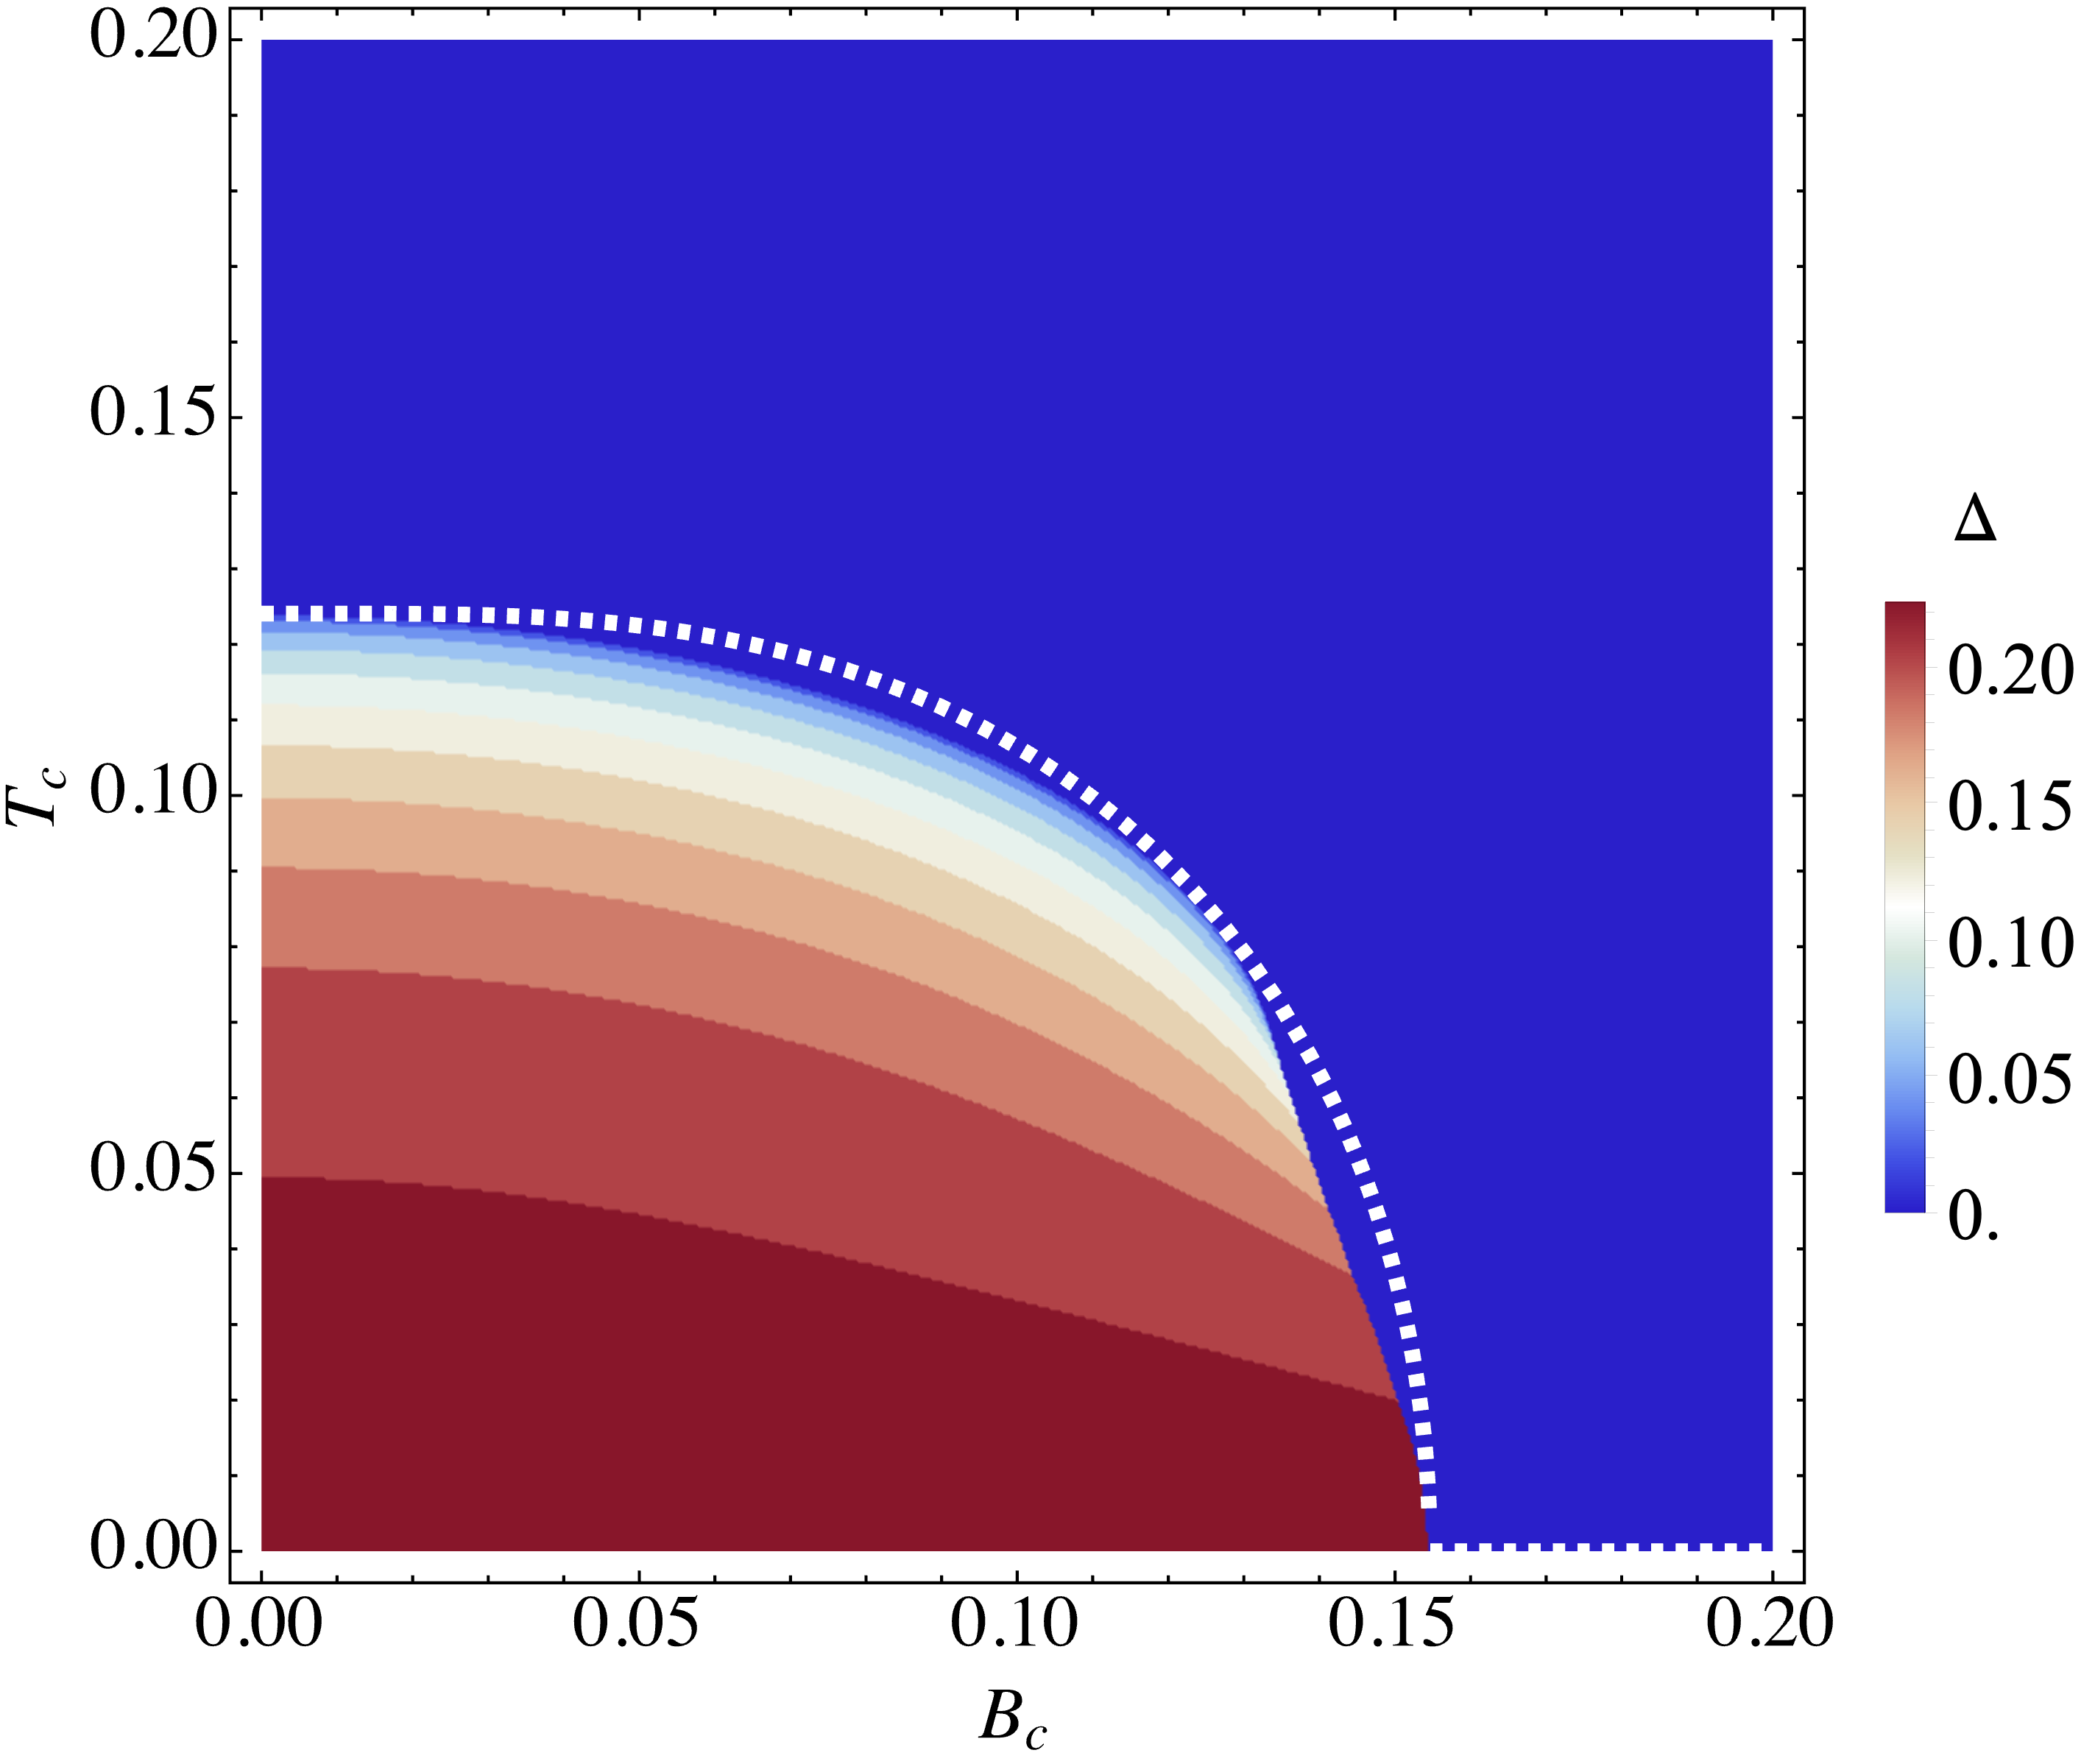
根据$\Delta(T = 0)=\Delta_0$时的序参量大小可以近似估计$^{[1]}$破坏超导态的最大临界磁场,在普通的超导体中成为Pauli极限,即外加的磁场使得两种不同的自旋感受到能量差,临界磁场近似为
- 改变磁场,自由能随序参量的变化
- 临界磁场与温度之间的依赖关系
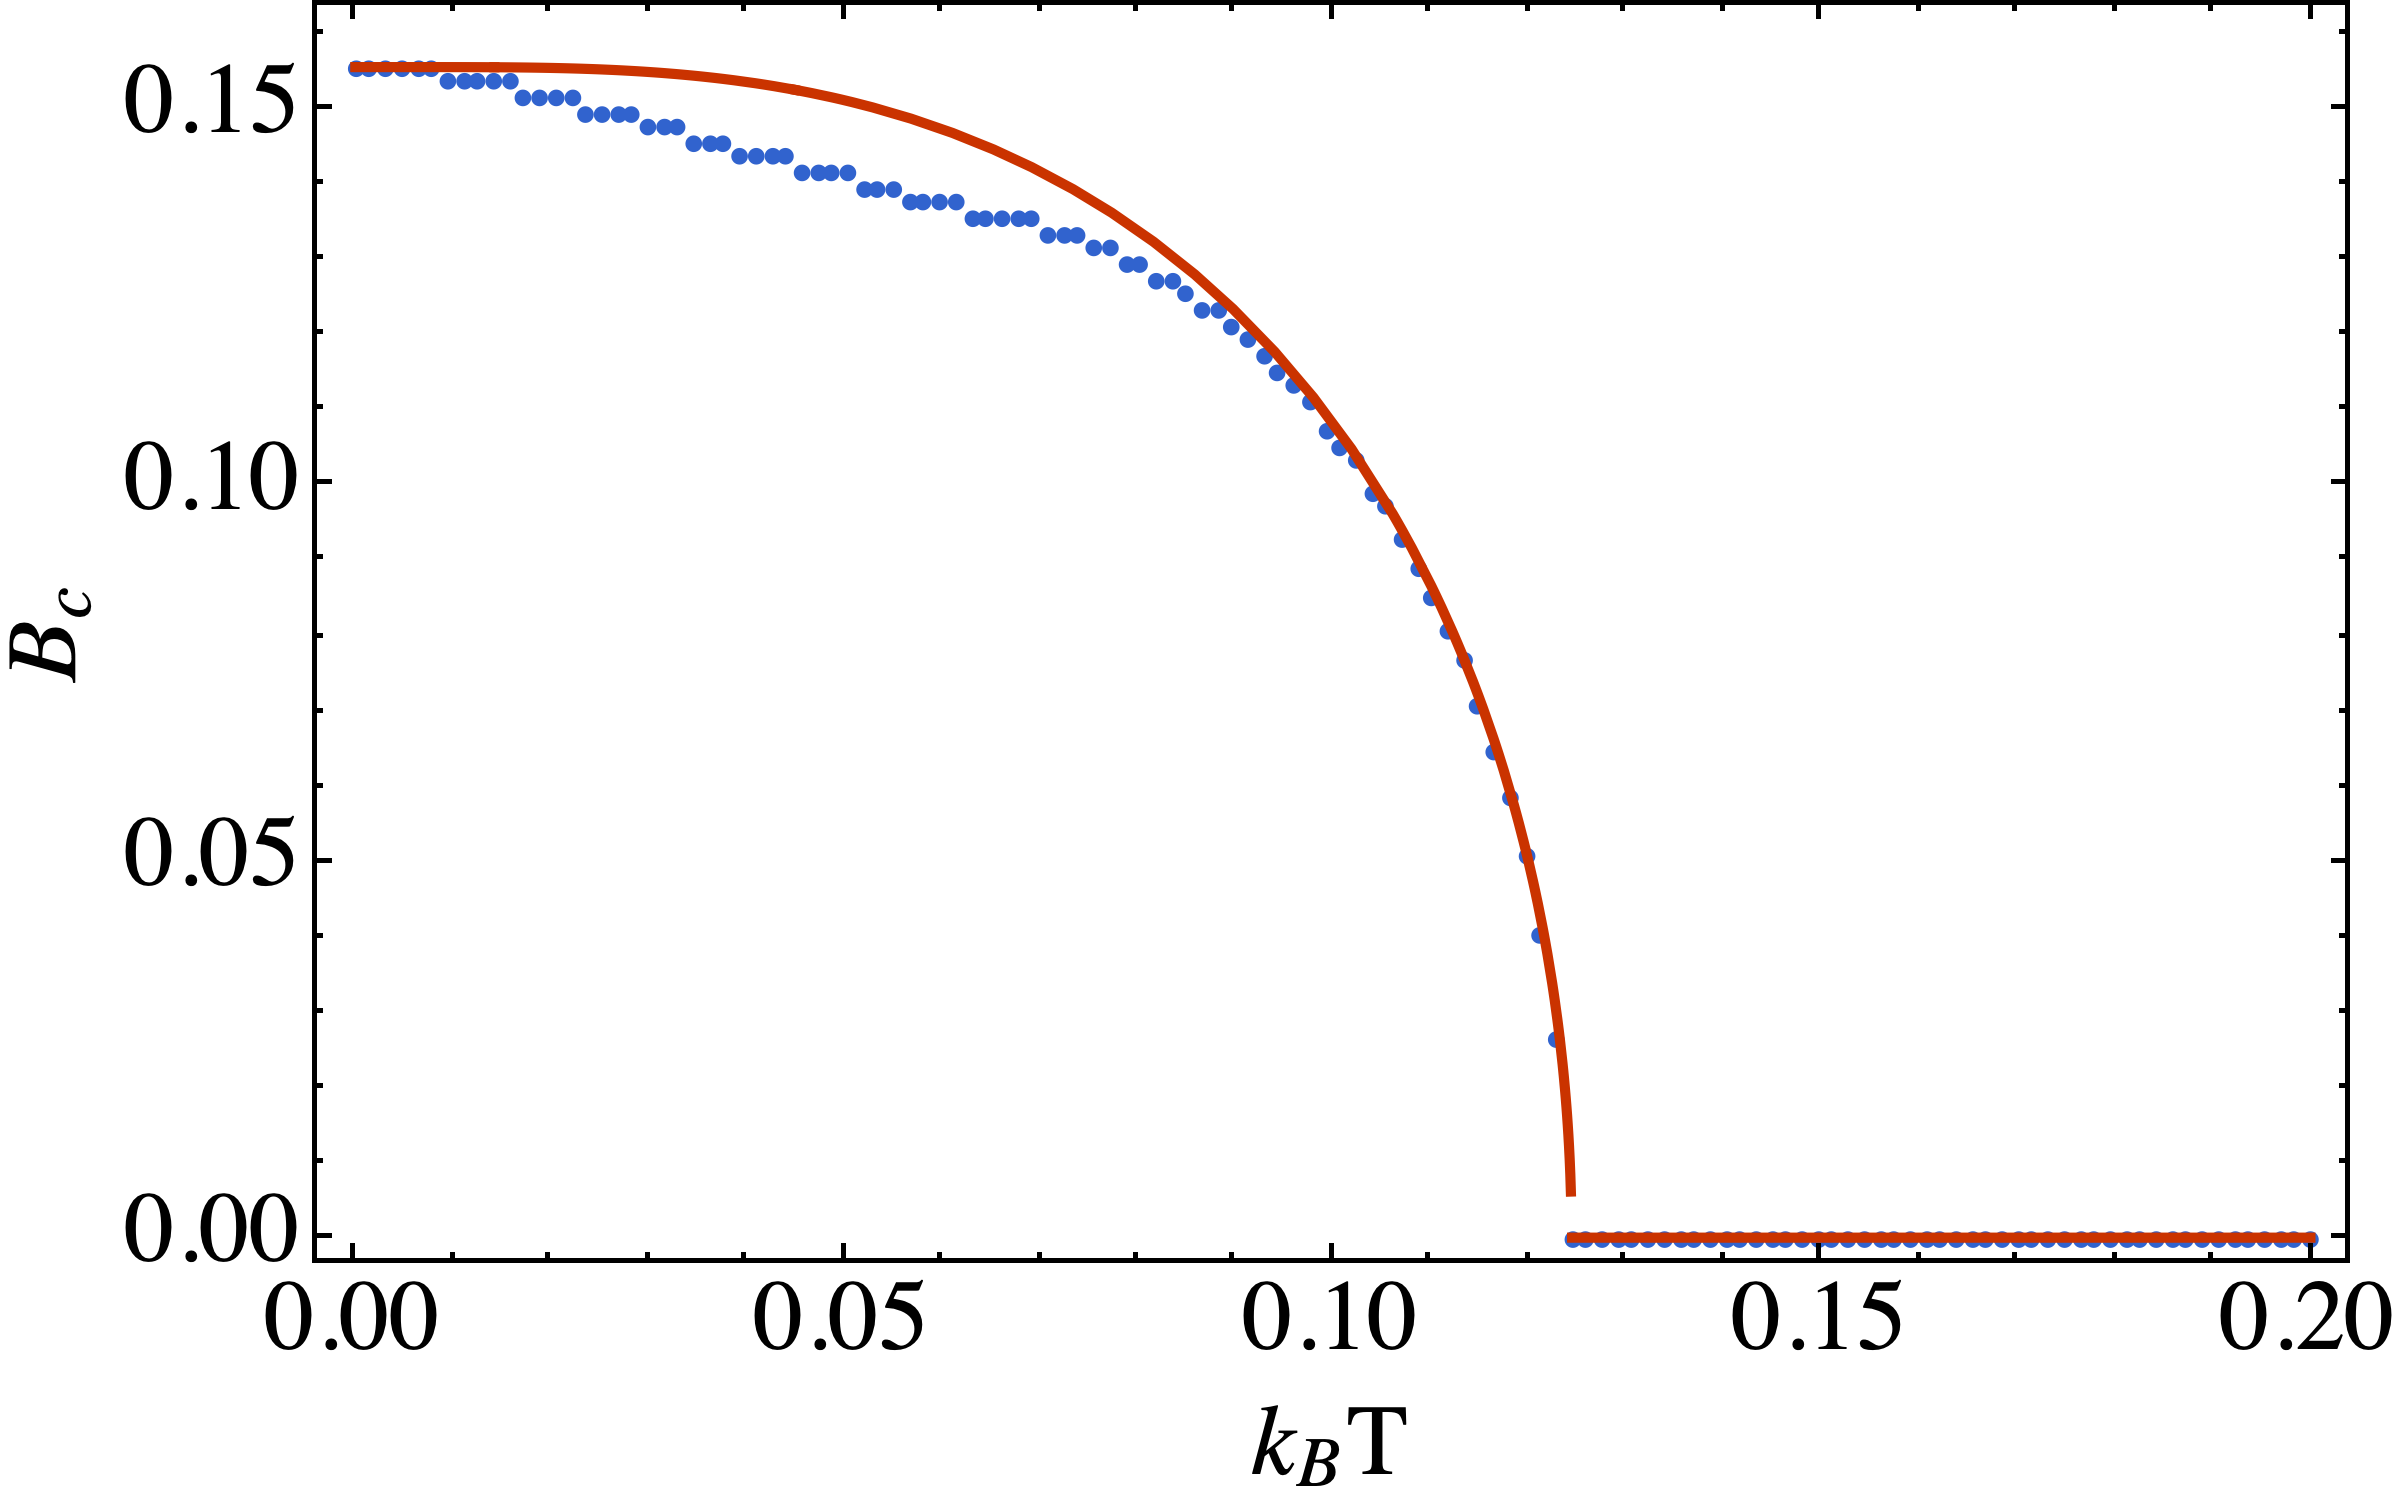
- 临界磁场($B_c$)与临界温度$Tc$之间的依赖关系,颜色深浅表示该参数下最小自由能对应的超导序参量$\Delta$
通过公式
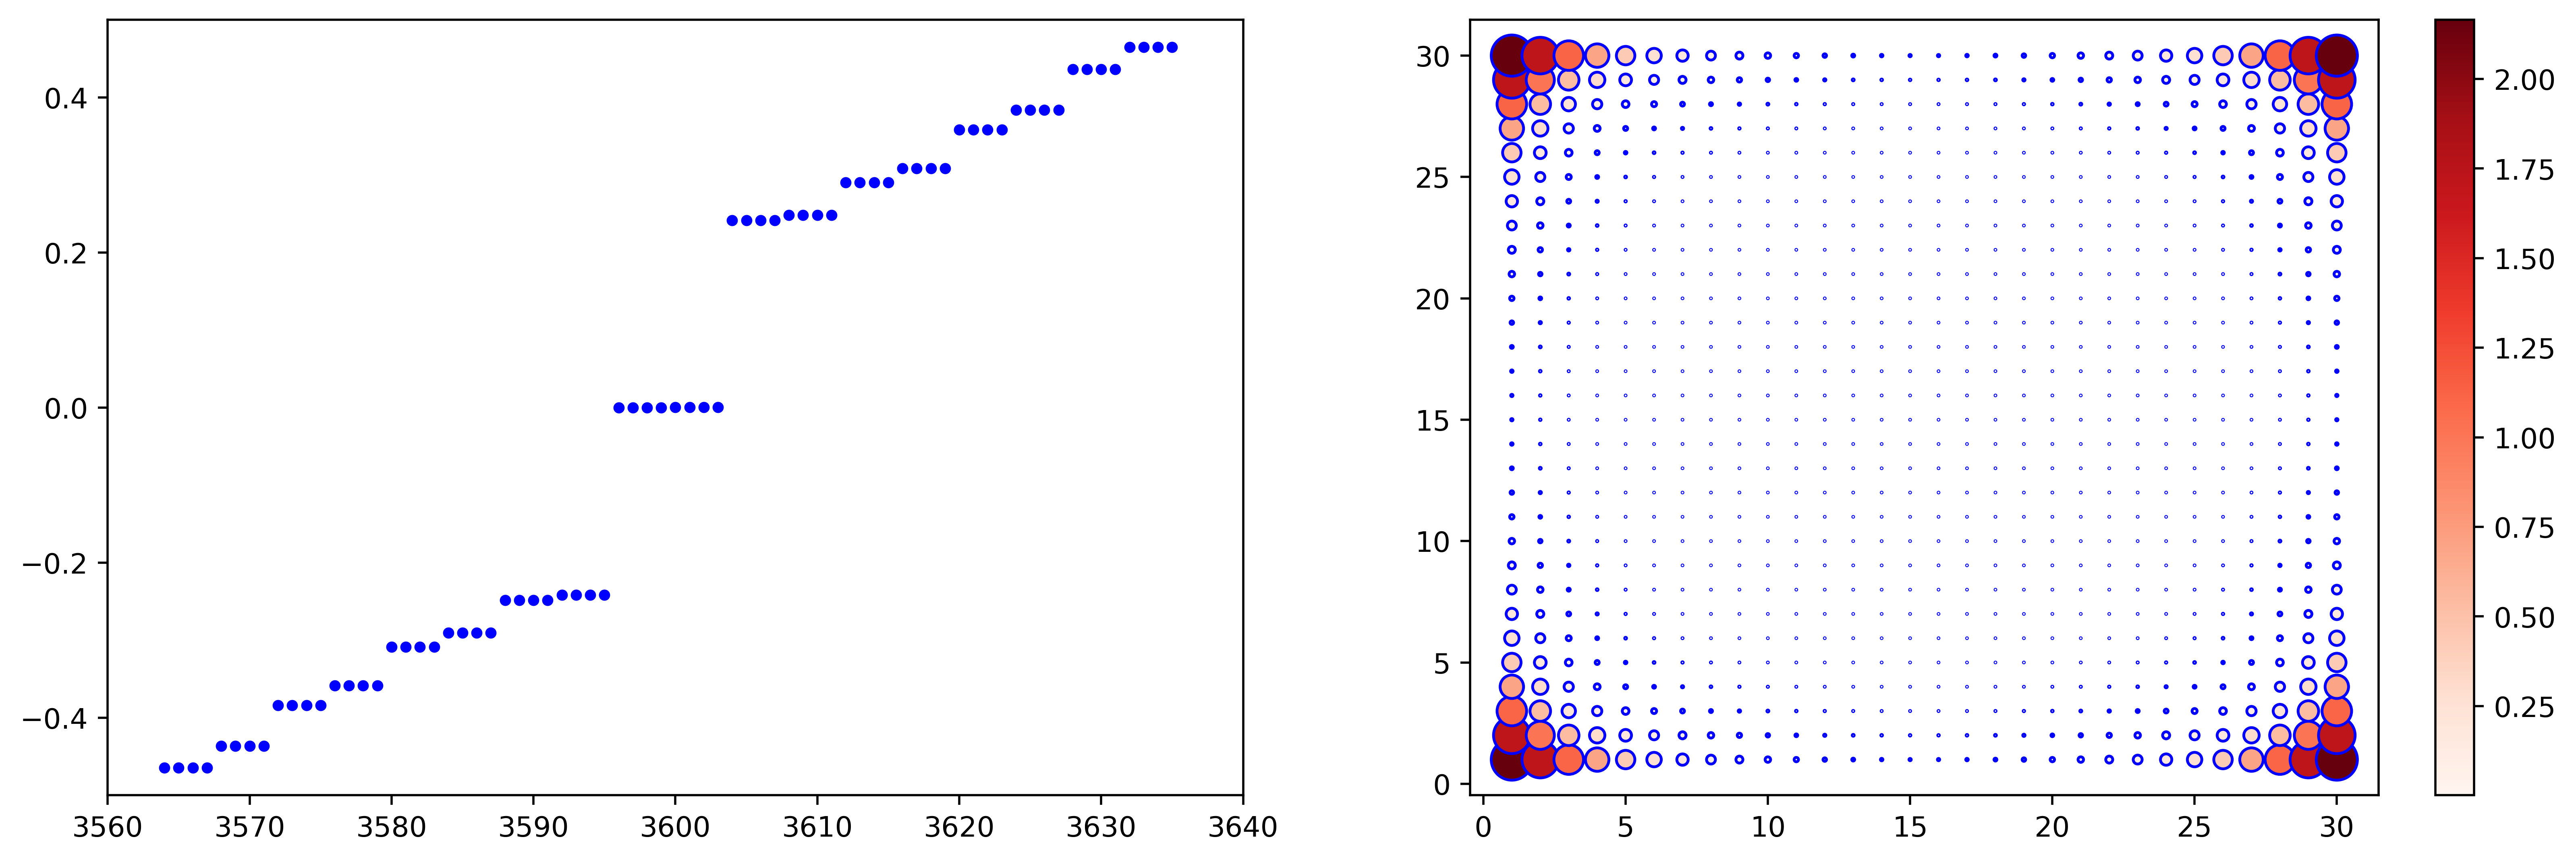
数据都打包放在了一起,可以点击这里下载
发现用Mathematica绘制的最后一个图效果不是很好,选择用Python重新绘制一下
1 | import numpy as np |
参考文献
- Pseudo-Ising superconductivity induced by $p$-wave magnetism
- Spin-Orbit-Parity-Coupled Superconductivity in Topological Monolayer WTe$_2$
鉴于该网站分享的大都是学习笔记,作者水平有限,若发现有问题可以发邮件给我
- yxliphy@gmail.com
也非常欢迎喜欢分享的小伙伴投稿
本博客所有文章除特别声明外,均采用 CC BY-NC-SA 4.0 许可协议。转载请注明来源 Yu-Xuan's Blog!


相关推荐
2019-04-17
Majorana Corner State in High Temperature Superconductor
最近刚刚学习了julia, 手头上也正好在重复一篇文章,就正好拿新学习的内容一边温习一边做研究。 导入函数库1234567# Import external package that use...

2020-07-01
两种方法计算Chern Number
计算Chern数是最初学习拓扑物理都会遇到的问题,正好在假期空闲的时候自己学习了一下Chern数的数值计算方法,在博客上记录一下希望可以帮助到别人。 具体的计算方法和细节就不在这里说明了,只...

2020-06-30
Kane Mele model zigzag 边界态的计算
接触量子自旋霍尔效应很久了,但是一直也都是在square lattice上做计算,从来没有认真的在六角点阵上计算过拓扑的内容,正好最近在看文献的过程中需要在石墨烯机构上进行,就从最基本的Kane...
评论
公告

欢迎关注公众号,有趣的内容也会在上面同步。 有密码的文章属于正在建设中或者没有通过验证的内容,若有需要可通过邮件联系。